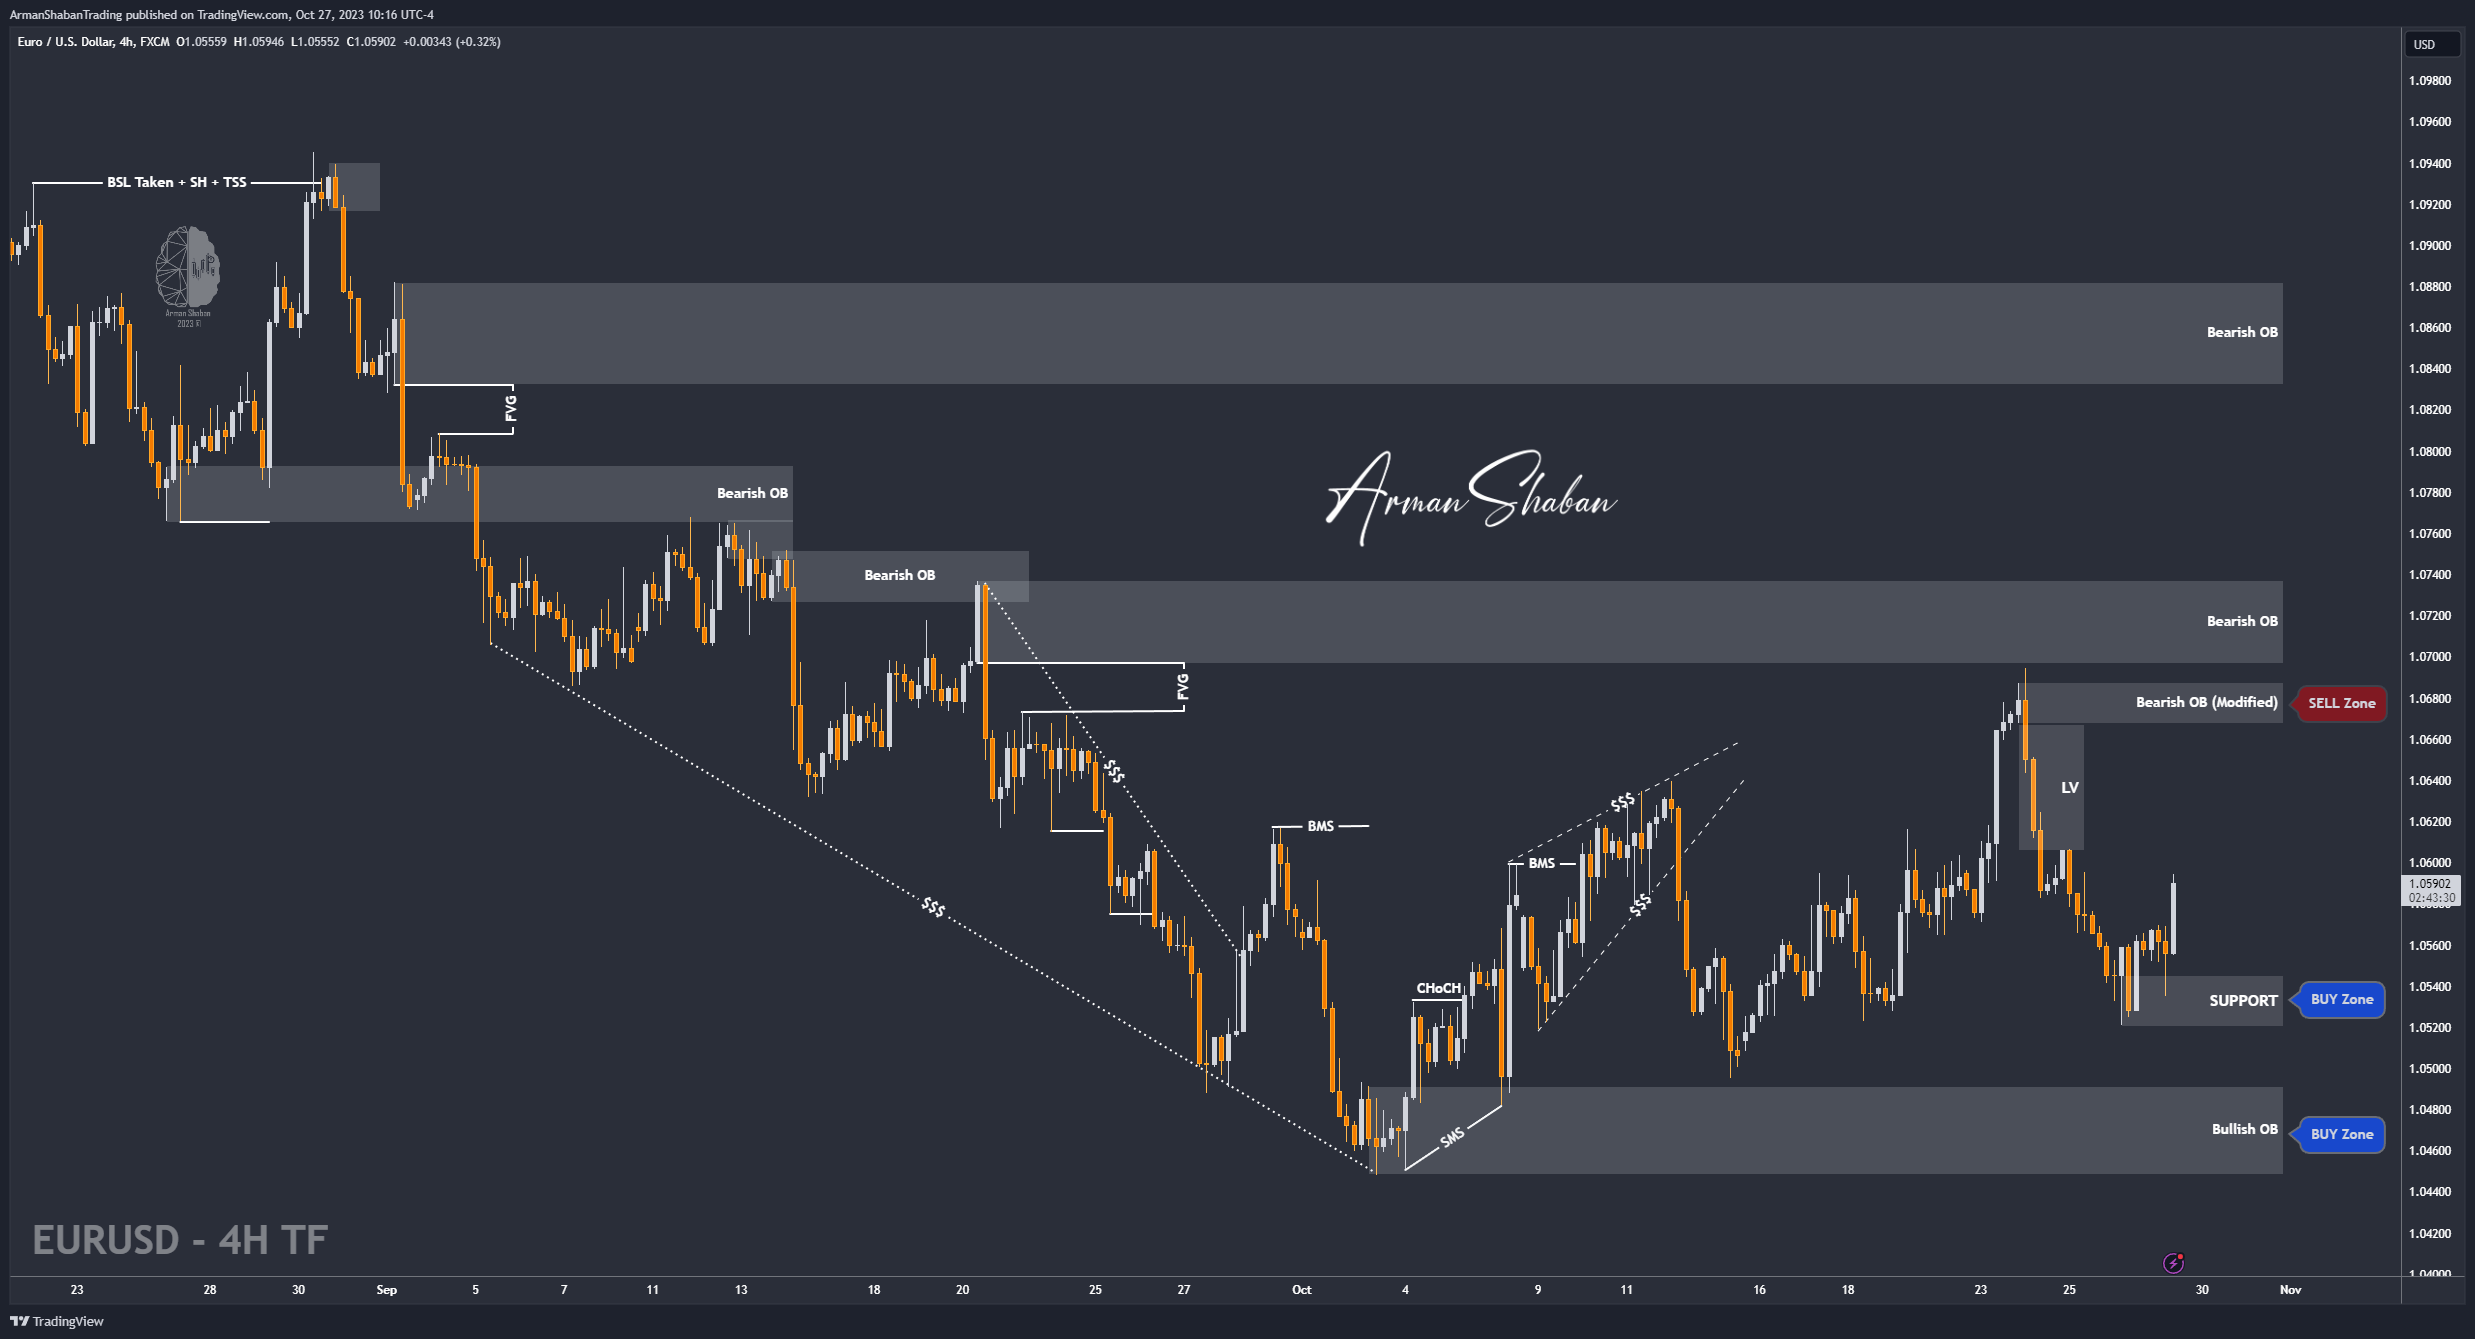
EUR/USD TA : 27.OCT.2023 4h TF (LONG)

By re-examining the EUR/USD chart, we see that the price in the range of 1.052 to 1.055 has a strong support that will probably prevent the price from falling further, and also that we have a large liquidity void in the range of 1.067 to 1.06060, which is likely to be filled in the short-term, this means that if the price can maintain the current support, we will see the growth of this symbol ! (LONG)
(This Post on TradingView)
Author : Arman Shaban
To see more analyzes of Gold , Forex Pairs , Cryptocurrencies , Indices and Stocks , be sure to Follow and Join us on other Platforms :
– Public Telegram Channel
– YouTube Channel
– TradingView
– X (Twitter)
– How to join our FOREX VIP Channel ?
– How to join our Crypto VIP Channel ?
– CONTACT ME directly on Telegram
3 Responses
[…] Ideas :– EUR/USD (GOLD) : 27.Oct.2023To see more analyzes of Gold , Forex Pairs , Cryptocurrencies , Indices and Stocks , be sure to […]
[…] Ideas :– EUR/USD : 02.Nov.2023– EUR/USD : 27.Oct.2023To see more analyzes of Gold , Forex Pairs , Cryptocurrencies , Indices […]
[…] : 18.ِDec.2023– EUR/USD : 11.ِDec.2023– EUR/USD : 19.Nov.2023– EUR/USD : 08.Nov.2023– EUR/USD : 02.Nov.2023To see more analyzes of Gold , Forex Pairs , Cryptocurrencies , Indices and Stocks , be sure to […]