Gold Analysis – 15.Sep.2026
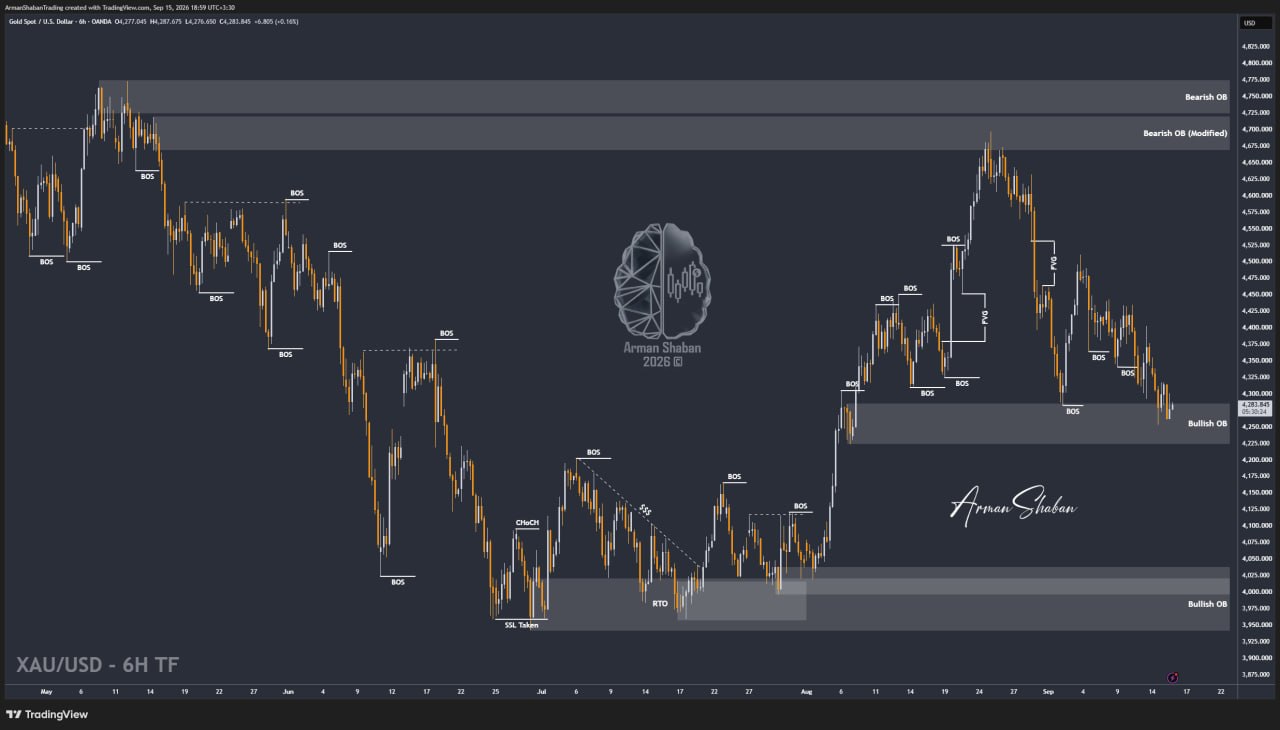
Gold Analysis: By analyzing the #Gold chart on the 6H timeframe, we can see that after the previous analysis, price continued trading inside the important $4224 – $4285 demand zone, but neither buyers nor sellers managed to create a strong directional move.
The nearest supply zones to watch are around $4300 – $4325, followed by $4360 – $4390 and then $4420 – $4460. On the downside, the current $4224 – $4285 area remains the main demand zone, followed by $4166 – $4200 and then $4120 – $4140.
For now, the market is still indecisive. Tomorrow should bring more volatility, so we’ll see whether Gold finally chooses a clear direction from these levels.
(This Post on TradingView)
Author : Arman Shaban
To see more analyzes of Gold , Forex Pairs , Cryptocurrencies , Indices and Stocks , be sure to Follow and Join us on other Platforms :
– Public Telegram Channel
– YouTube Channel
– TradingView
– X (Twitter)
– How to join our FOREX VIP Channel ?
– How to join our Crypto VIP Channel ?
– CONTACT ME directly on Telegram

