Gold Analysis – 14.Sep.2026
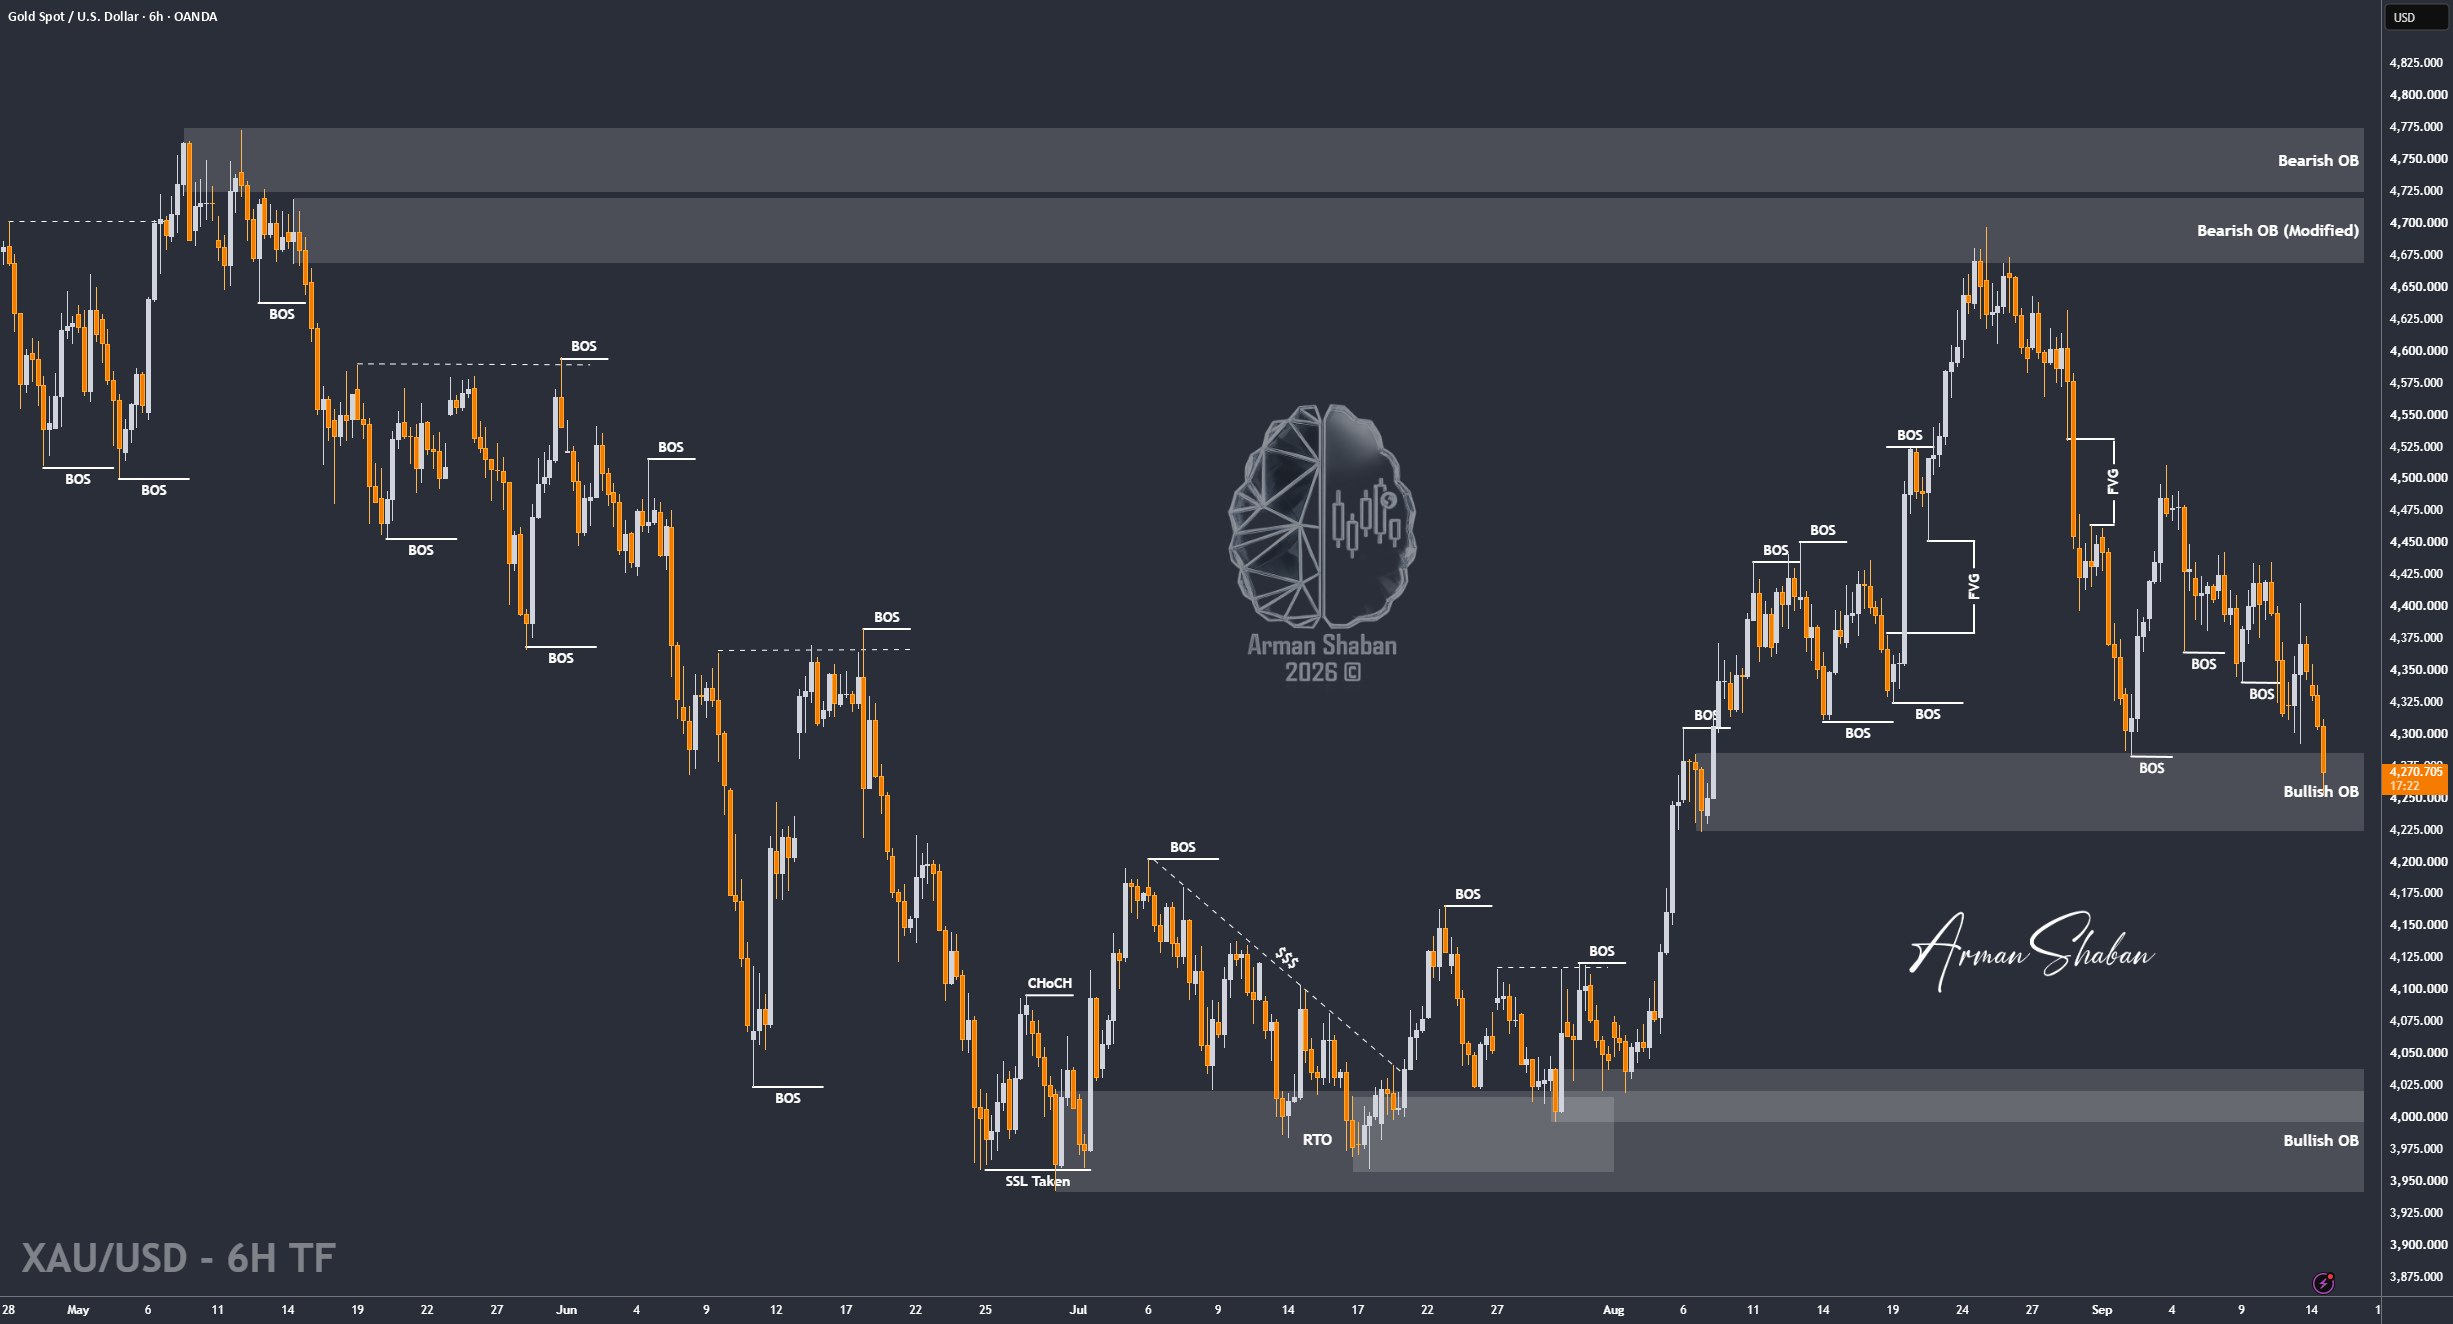
Gold Analysis: By analyzing the #Gold chart on the 6H timeframe, we can see that after the previous analysis, selling pressure continued and Gold dropped as low as $4253. Currently, price is trading around $4270 and sitting inside a very important demand zone.
The key area to watch is $4224 – $4285. If buyers manage to defend this zone, we could see another recovery from here. However, if Gold breaks and stabilizes below this area, the probability of a much deeper sell-off increases.
In that case, I’ll be watching $4200 first, followed by $4166 and potentially $4122 as the next major downside targets.
For now, everything depends on the reaction from this demand zone. I’ll update this analysis again soon, so keep the support coming if you want the next update faster.
(This Post on TradingView)
Author : Arman Shaban
To see more analyzes of Gold , Forex Pairs , Cryptocurrencies , Indices and Stocks , be sure to Follow and Join us on other Platforms :
– Public Telegram Channel
– YouTube Channel
– TradingView
– X (Twitter)
– How to join our FOREX VIP Channel ?
– How to join our Crypto VIP Channel ?
– CONTACT ME directly on Telegram

