Gold Analysis – 28.Sep.2026
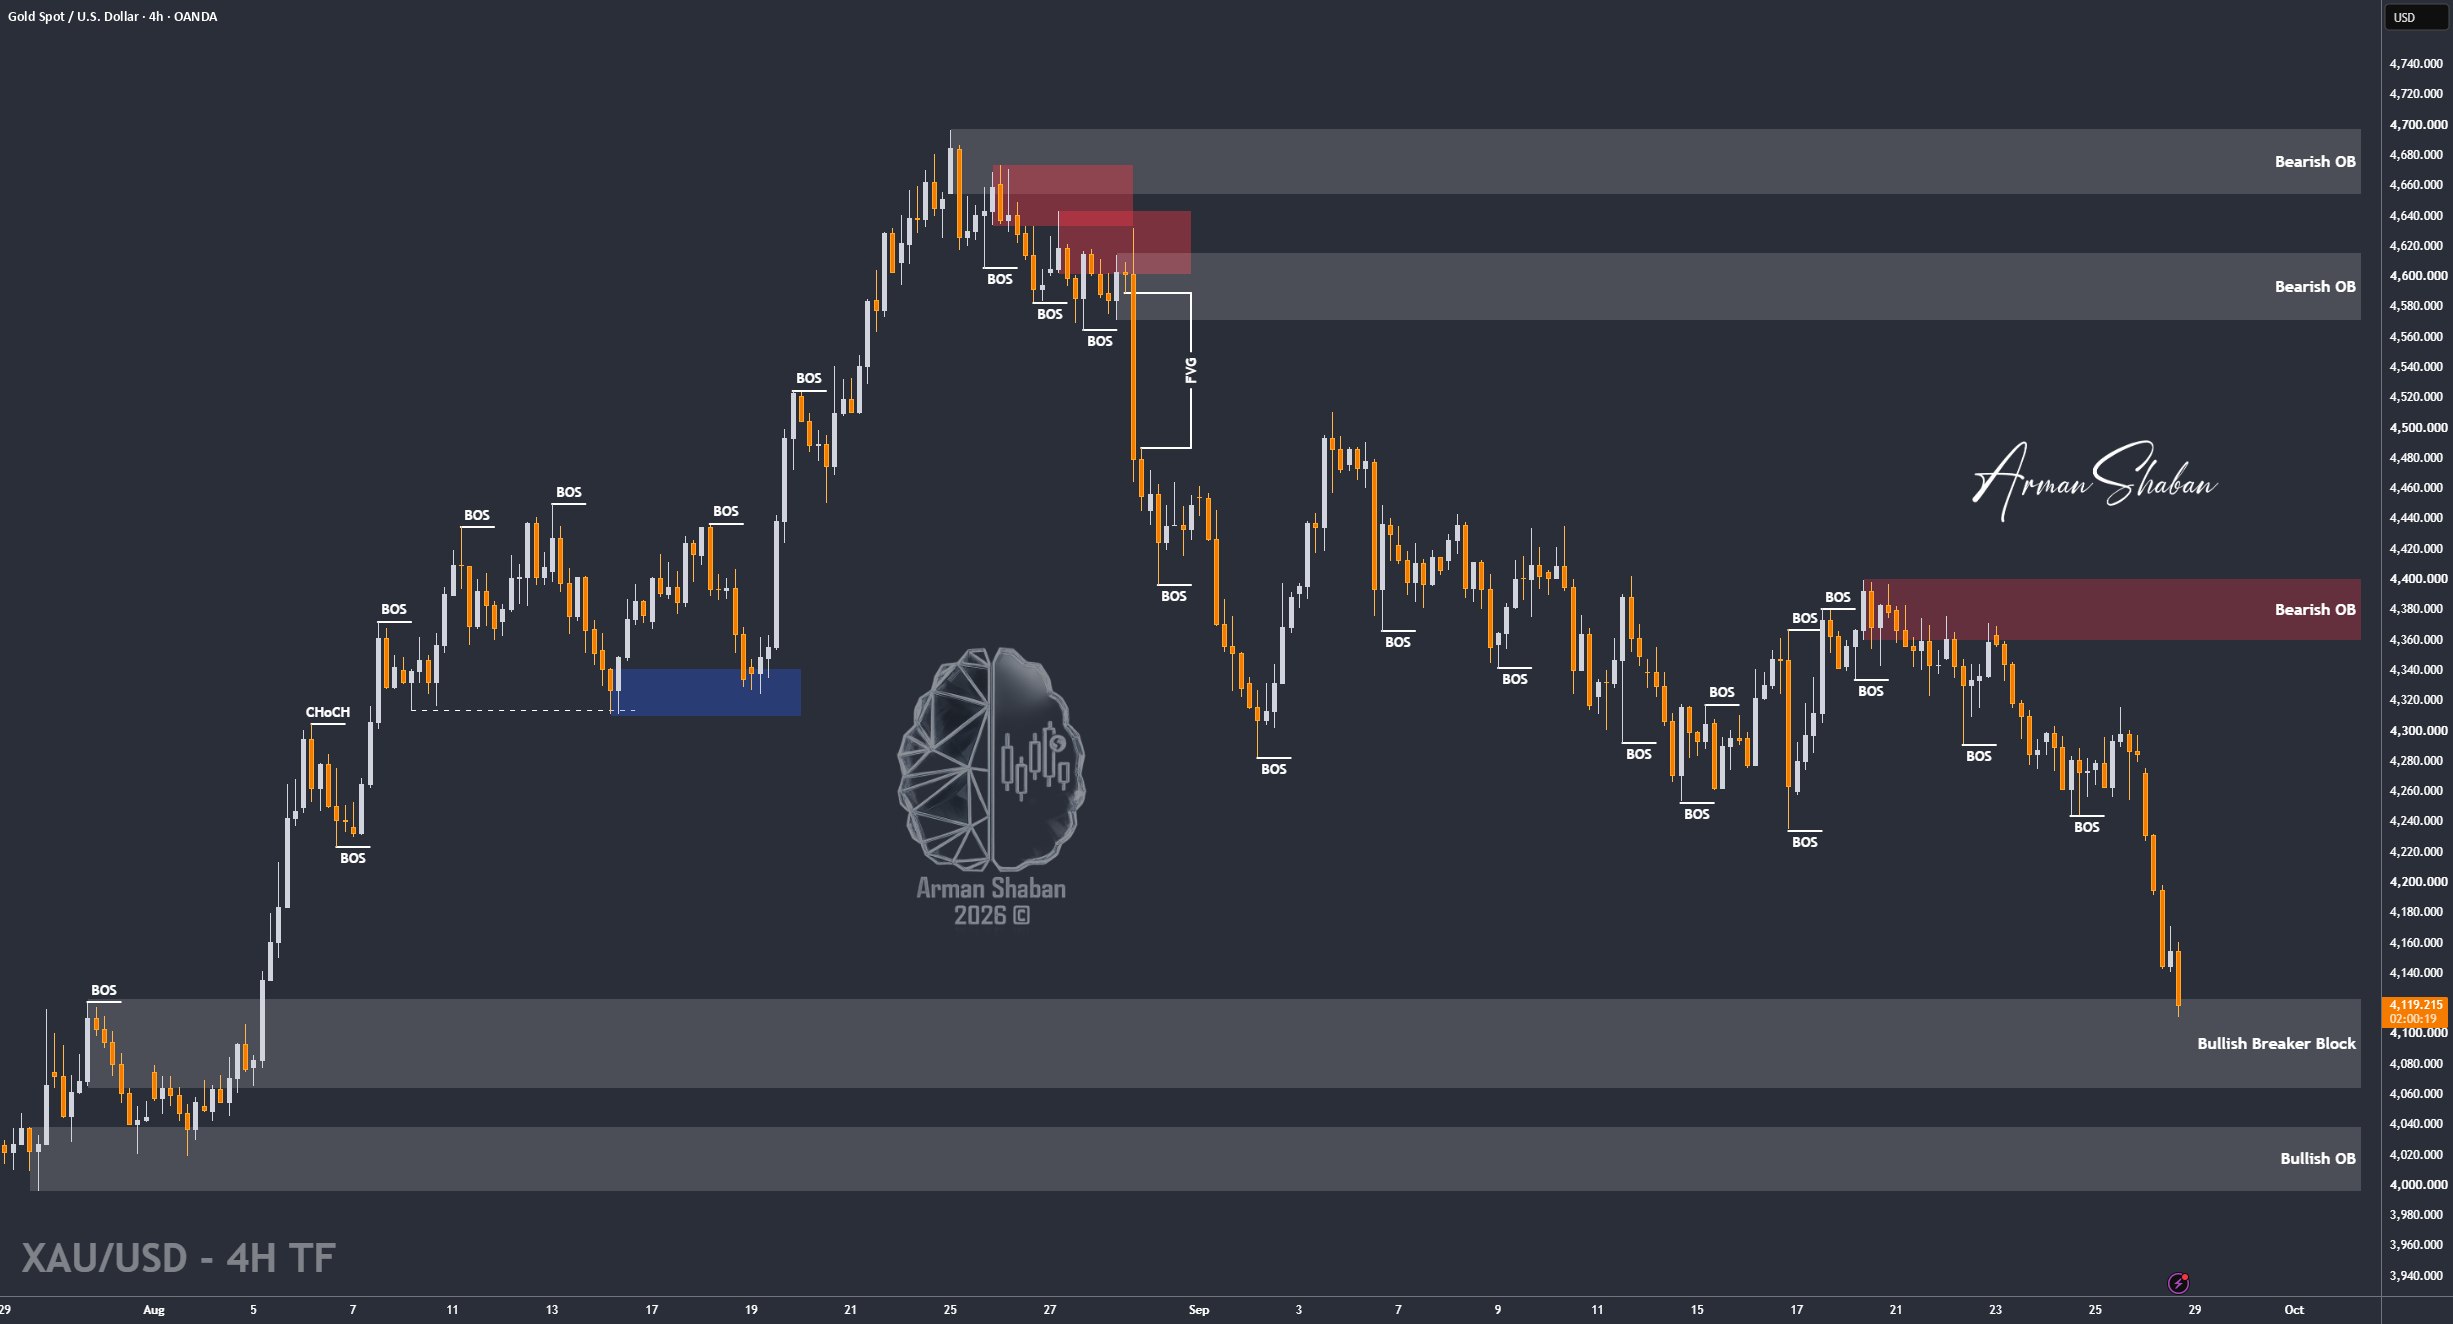
Gold Analysis: By analyzing the #Gold chart on the 4H timeframe, we can see that the bearish scenario played out beautifully. Gold reached all our downside targets at $4279, $4263, $4244 and $4234, then continued collapsing all the way toward $4114, delivering more than 1700 pips of movement today alone.
Price has now reached an important Bullish Breaker Block, so I expect some short-term buying pressure and a possible corrective move higher. We also still have the weekly opening gap between $4275 and $4283, and in my view there is a high probability that this gap will be filled within the next one or two weeks.
The nearest demand area is around $4100 – $4130, followed by $4060 – $4080. On the upside, the important supply areas are around $4165 – $4190, then $4220 – $4245, while the $4275 – $4283 gap remains the larger upside magnet.
My main bias is still bearish. I expect an initial recovery first, but after that Gold could start another bearish leg and eventually trade below the psychological $4100 level.
(This Post on TradingView)
Author : Arman Shaban
To see more analyzes of Gold , Forex Pairs , Cryptocurrencies , Indices and Stocks , be sure to Follow and Join us on other Platforms :
– Public Telegram Channel
– YouTube Channel
– TradingView
– X (Twitter)
– How to join our FOREX VIP Channel ?
– How to join our Crypto VIP Channel ?
– CONTACT ME directly on Telegram

