Gold Analysis – 29.Sep.2026
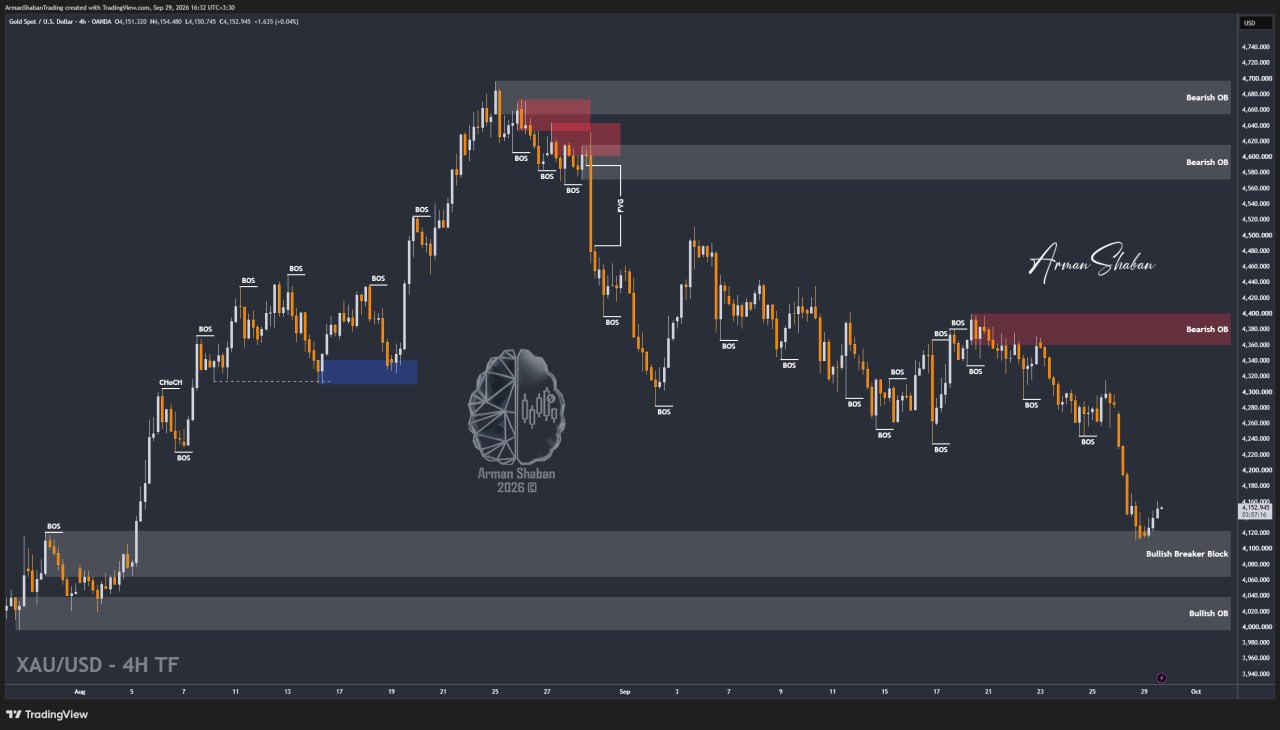
Gold Analysis: By analyzing the #Gold chart on the 4H timeframe, we can see that after the previous analysis, Gold reacted positively from the $4110 – $4120 Bullish Breaker Block and completed the corrective move we were waiting for, reaching as high as $4162. Price is currently trading around $4153.
The most important area right now is $4140 – $4170. In my view, there is a good chance sellers react from this zone and the bearish move resumes. In that case, the downside targets I’m watching are $4120, $4100, $4080 and $4060.
However, if Gold manages to break through this area and hold above $4170, the correction could extend toward $4200 and $4230.
For now, my broader bias remains bearish. The bullish reaction we expected has happened, and now the reaction from this supply zone should tell us whether sellers are ready for the next move lower.
(This Post on TradingView)
Author : Arman Shaban
To see more analyzes of Gold , Forex Pairs , Cryptocurrencies , Indices and Stocks , be sure to Follow and Join us on other Platforms :
– Public Telegram Channel
– YouTube Channel
– TradingView
– X (Twitter)
– How to join our FOREX VIP Channel ?
– How to join our Crypto VIP Channel ?
– CONTACT ME directly on Telegram

