Gold Analysis – 02.Oct.2026
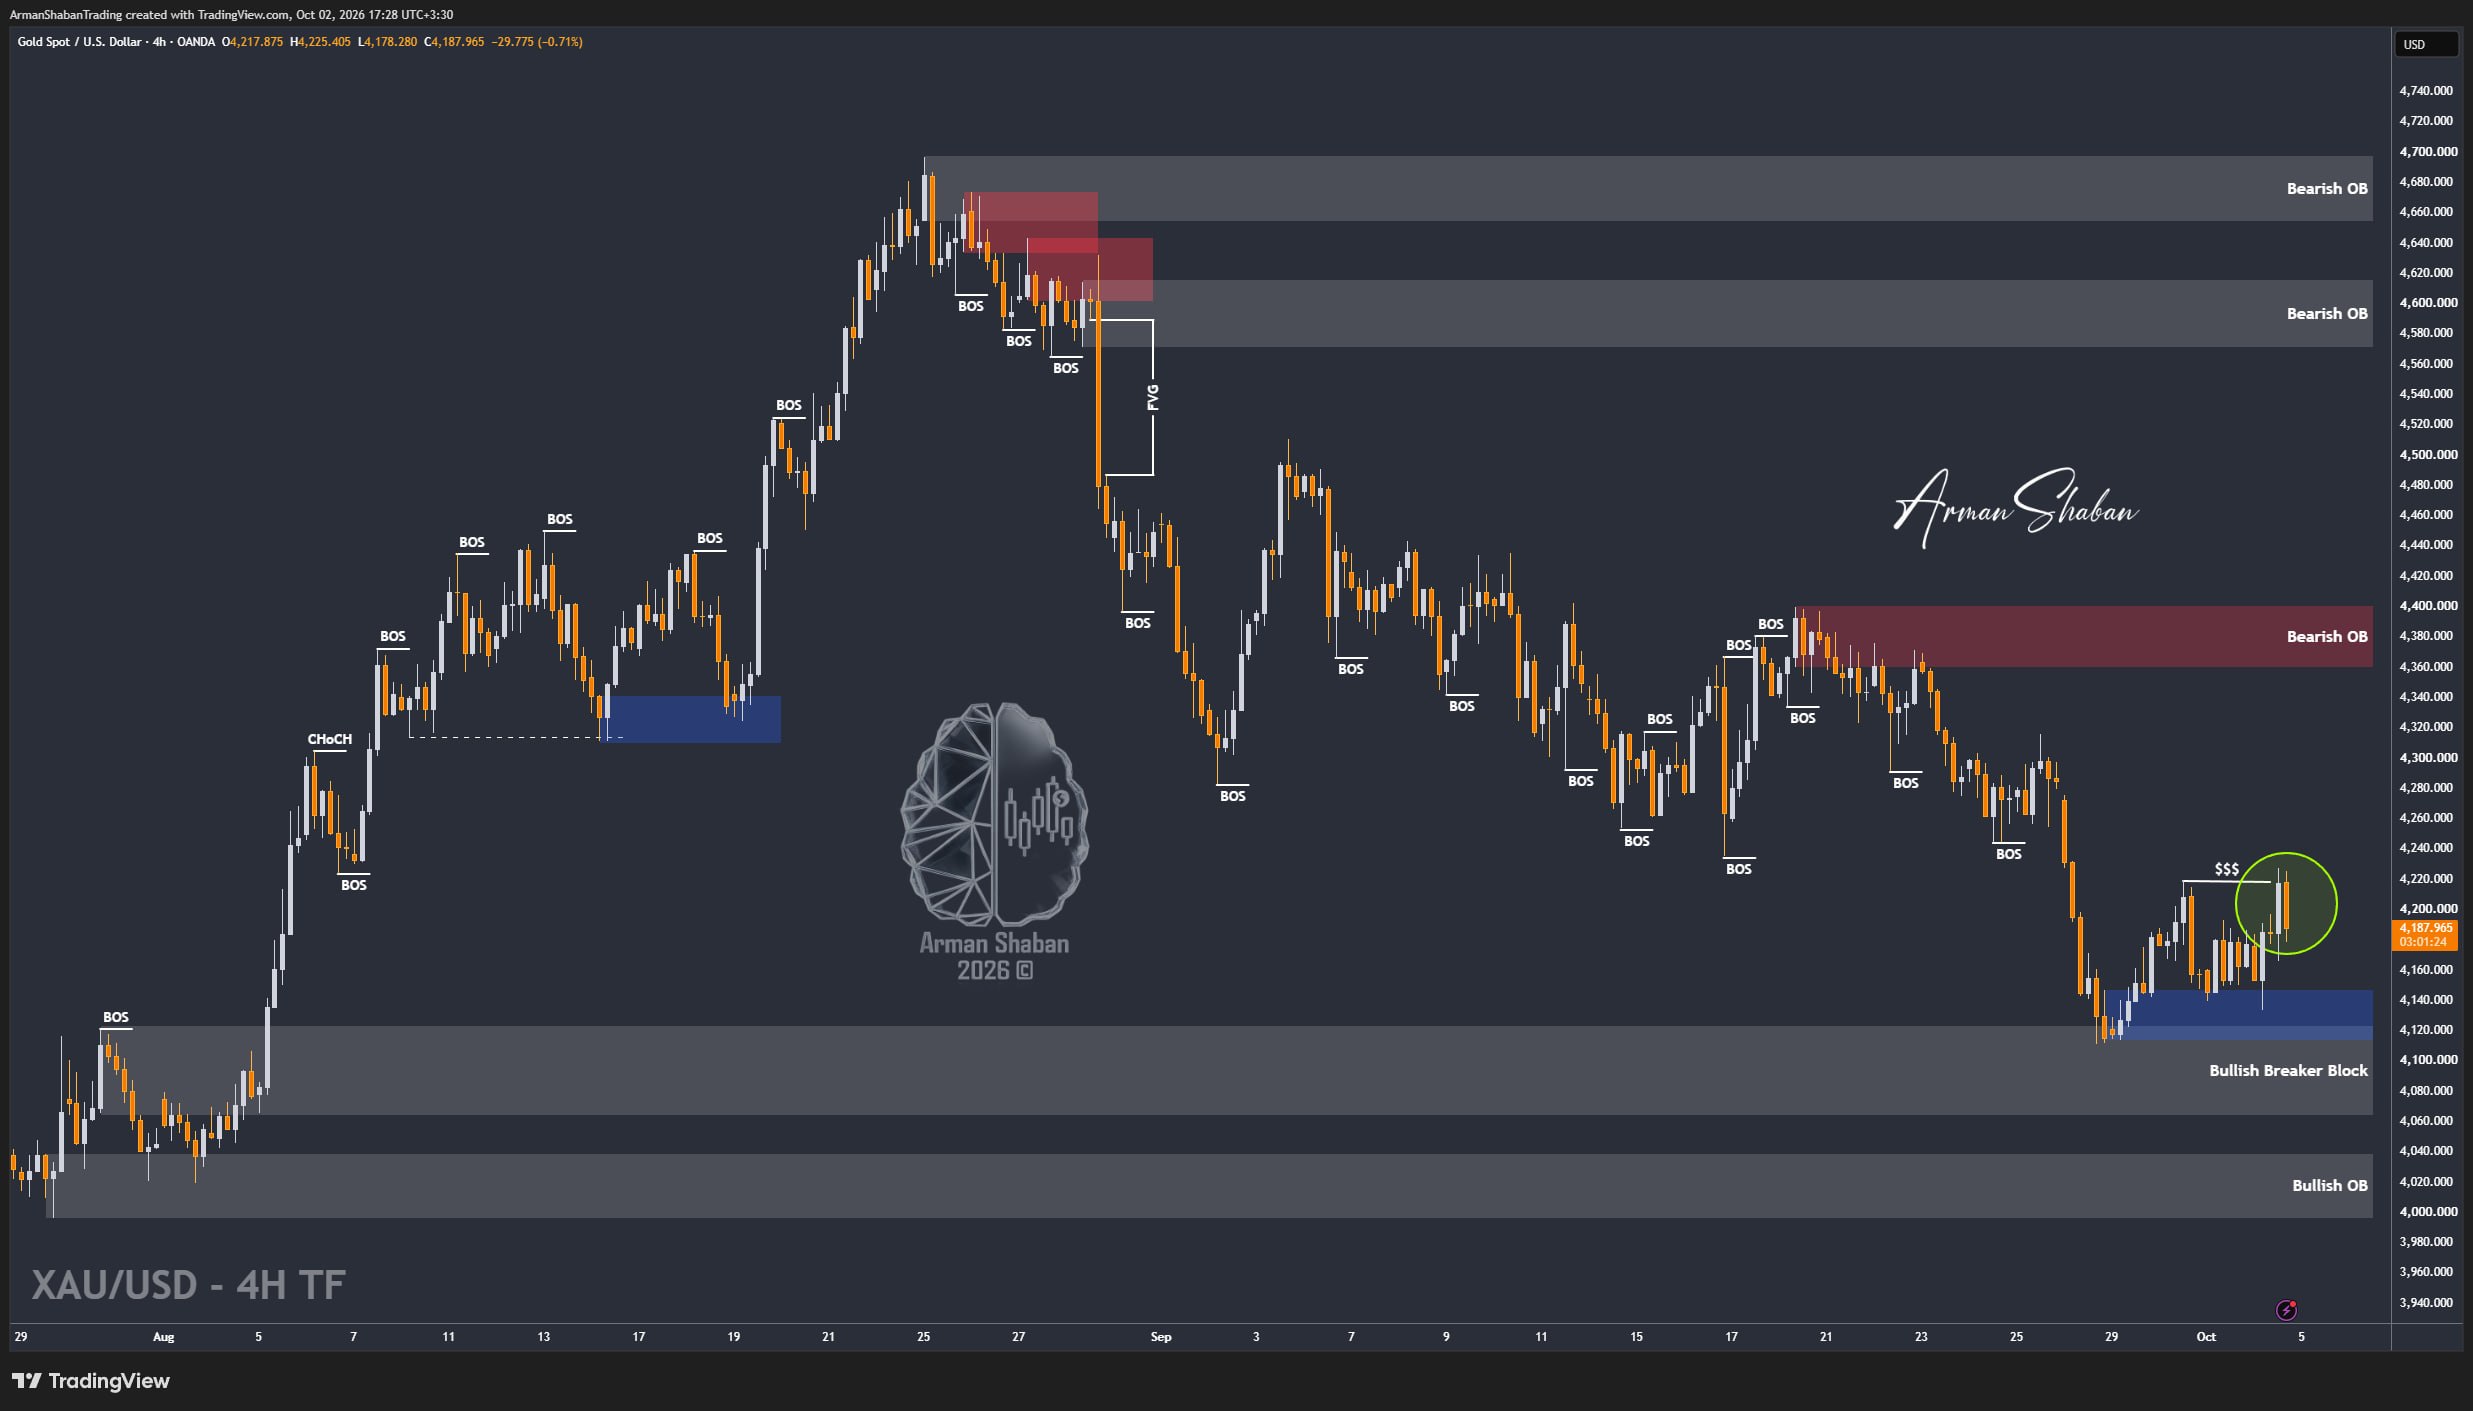
Gold Analysis: By analyzing the #Gold chart on the 4H timeframe, we can see that after the previous analysis, price successfully defended our $4114 – $4145 demand zone and continued moving higher. Today’s NFP release added more volatility, pushing Gold as high as $4228, exactly sweeping the liquidity resting above our important $4220 target!
After collecting this liquidity, Gold faced selling pressure and is currently trading around $4180.
The most important area to watch now is the $4150 – $4175 demand zone. If buyers manage to defend this region, another bullish attempt toward $4200, $4220 and potentially higher levels remains possible.
The nearest supply zones are around $4193 – $4203, followed by $4219 – $4233, $4244 – $4254 and the major $4275 – $4284 FVG. On the downside, the important demand areas are $4150 – $4175, followed by $4114 – $4145 and the deeper $4080 – $4100 region.
For now, I prefer to watch how Gold reacts to the current demand zone rather than rush into a new directional bias. A decisive break below $4150 could open the way toward $4145 and $4114 again.
Let’s see if buyers can defend this area after today’s liquidity sweep!
(This Post on TradingView)
Author : Arman Shaban
To see more analyzes of Gold , Forex Pairs , Cryptocurrencies , Indices and Stocks , be sure to Follow and Join us on other Platforms :
– Public Telegram Channel
– YouTube Channel
– TradingView
– X (Twitter)
– How to join our FOREX VIP Channel ?
– How to join our Crypto VIP Channel ?
– CONTACT ME directly on Telegram

