Gram Analysis – 29.Jun.2026
Gram Analysis: By analyzing the #GRAM chart on the weekly timeframe, we can see that TONCOIN is now being tracked under the GRAM symbol, so from now on we will continue updating this chart with the new ticker. 😁
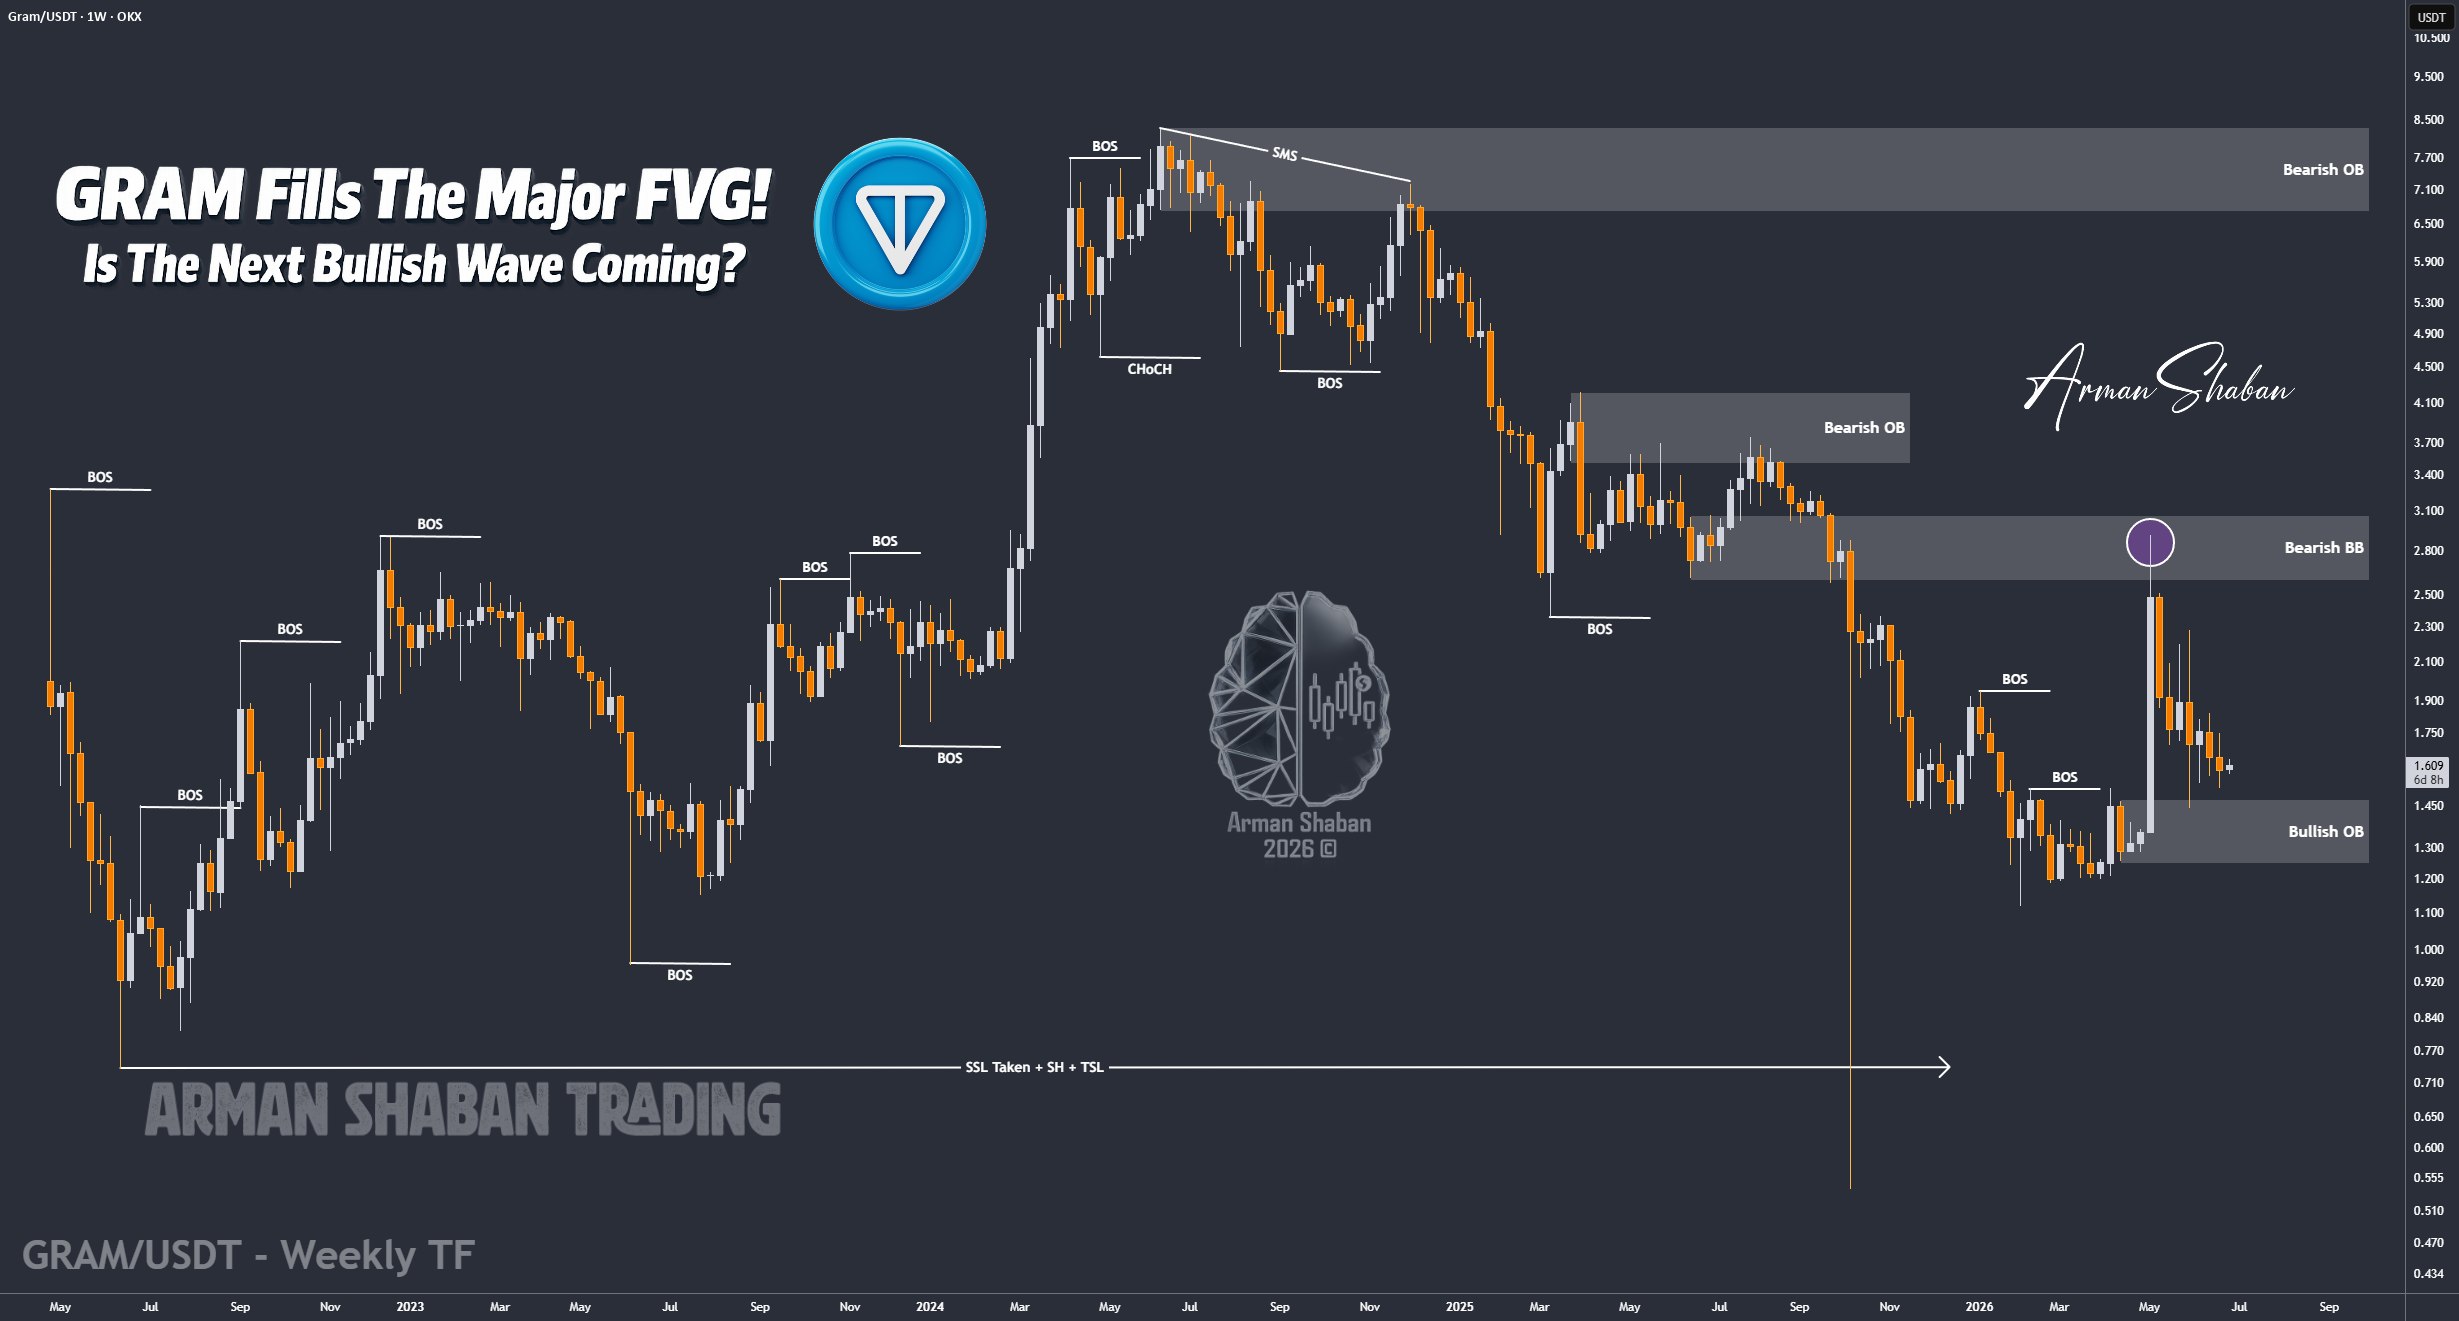
After the broader crypto market sell-off, GRAM also experienced a heavy correction. However, this drop was technically important because price managed to fully fill the large FVG created during the previous rally from around $1.30 to $2.90.
Currently, GRAM is trading around the $1.60 region. The key demand zone to watch is between $1.25 and $1.47. As long as price manages to hold and stabilize above this area, the broader bullish scenario remains valid and we can expect another recovery attempt from this level.
The nearest supply zones are located around $1.75 – $1.90, followed by stronger resistance areas around $2.10 – $2.30 and $2.60 – $2.90.
If buyers regain momentum from this demand zone, the next upside targets to monitor are $1.75, followed by $1.90, then $2.20, $2.60, and potentially $2.90 if bullish momentum returns to the broader crypto market.
For now, this correction looks like a liquidity reset and FVG fill rather than a complete trend failure, but price must continue holding above the $1.25 – $1.47 demand zone.
(This Post on TradingView)
Author : Arman Shaban
To see more analyzes of Gold , Forex Pairs , Cryptocurrencies , Indices and Stocks , be sure to Follow and Join us on other Platforms :
– Public Telegram Channel
– YouTube Channel
– TradingView
– X (Twitter)
– How to join our FOREX VIP Channel ?
– How to join our Crypto VIP Channel ?
– CONTACT ME directly on Telegram