Gold Analysis – 03.Aug.2026
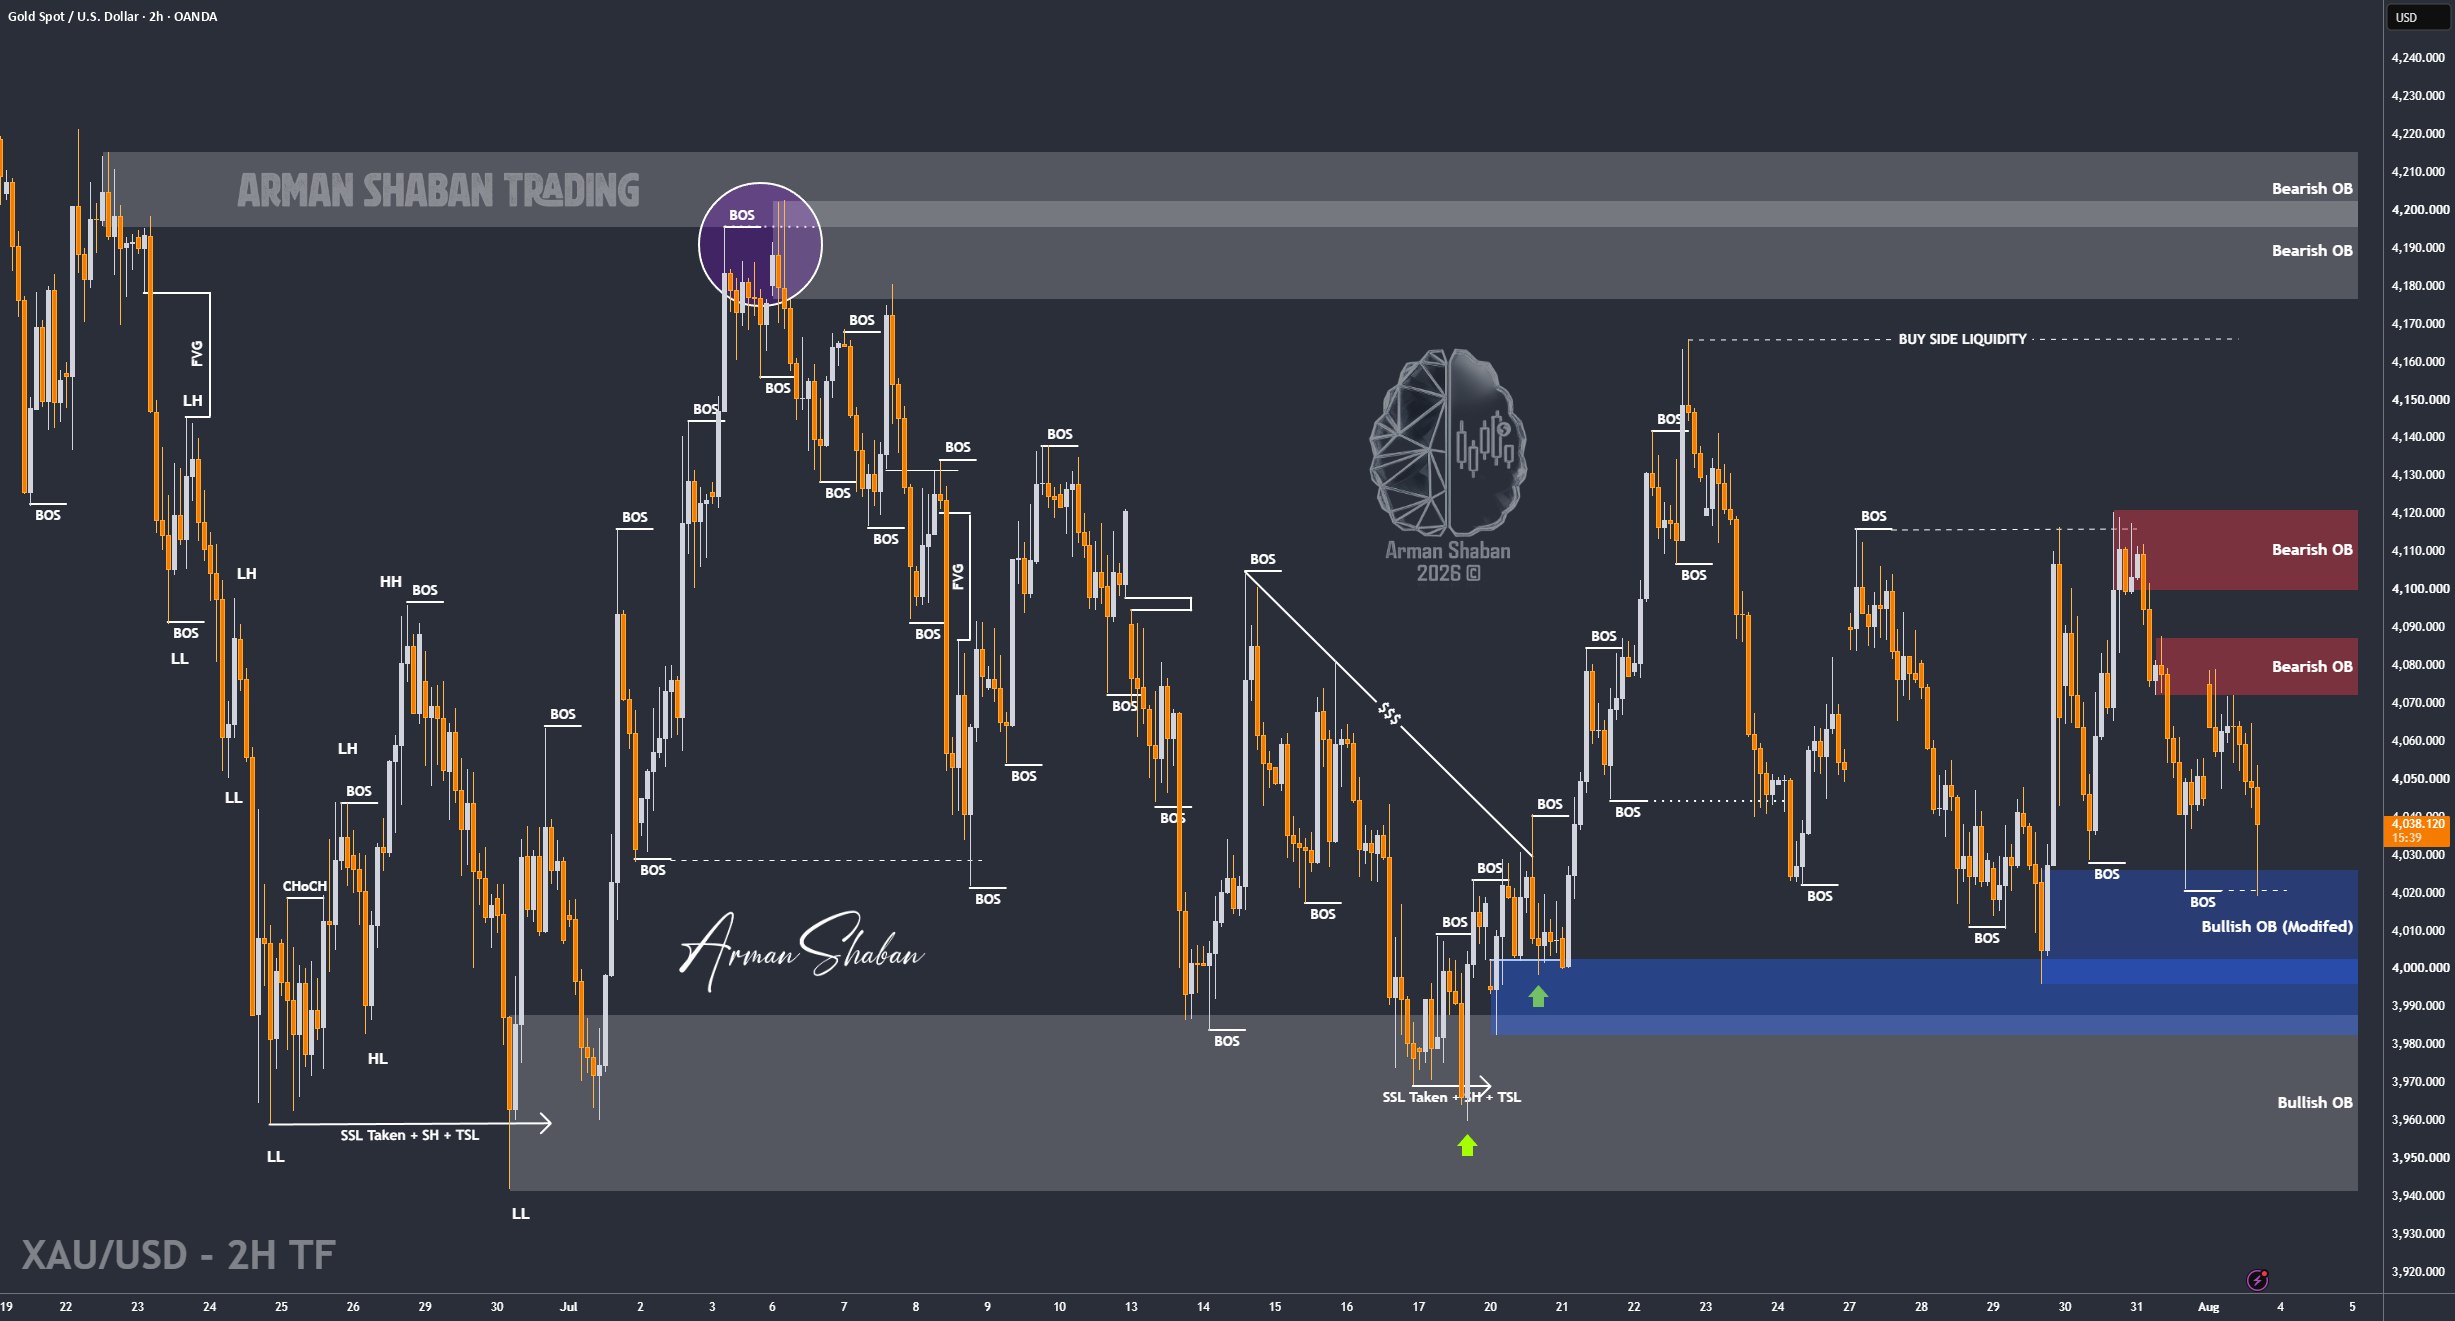
Gold Analysis: By analyzing the #Gold chart on the 2H timeframe, we can see that Gold opened the new session with a bullish gap and pushed toward the $4080 region. Once price entered this important supply area, sellers stepped in and pushed Gold sharply lower toward $4019.
After sweeping the liquidity below $4020, buyers became active and Gold is currently trading around $4035.
In my view, we may first see a short-term recovery toward the nearby supply zones. However, once price reaches these areas, another bearish reaction and corrective move could develop.
The nearest supply zones are located around $4048 – $4060, followed by $4070 – $4085 and the stronger resistance area between $4100 – $4120.
On the downside, the nearest demand zones are located around $4018 – $4030, followed by $3990 – $4005 and deeper support between $3960 – $3980.
For now, closely monitor price reactions around these key supply and demand zones. Make sure to open the chart in the highest available quality and study the marked levels carefully so you do not miss the potential setups.
(This Post on TradingView)
Author : Arman Shaban
To see more analyzes of Gold , Forex Pairs , Cryptocurrencies , Indices and Stocks , be sure to Follow and Join us on other Platforms :
– Public Telegram Channel
– YouTube Channel
– TradingView
– X (Twitter)
– How to join our FOREX VIP Channel ?
– How to join our Crypto VIP Channel ?
– CONTACT ME directly on Telegram

