Gold Analysis – 06.Aug.2026
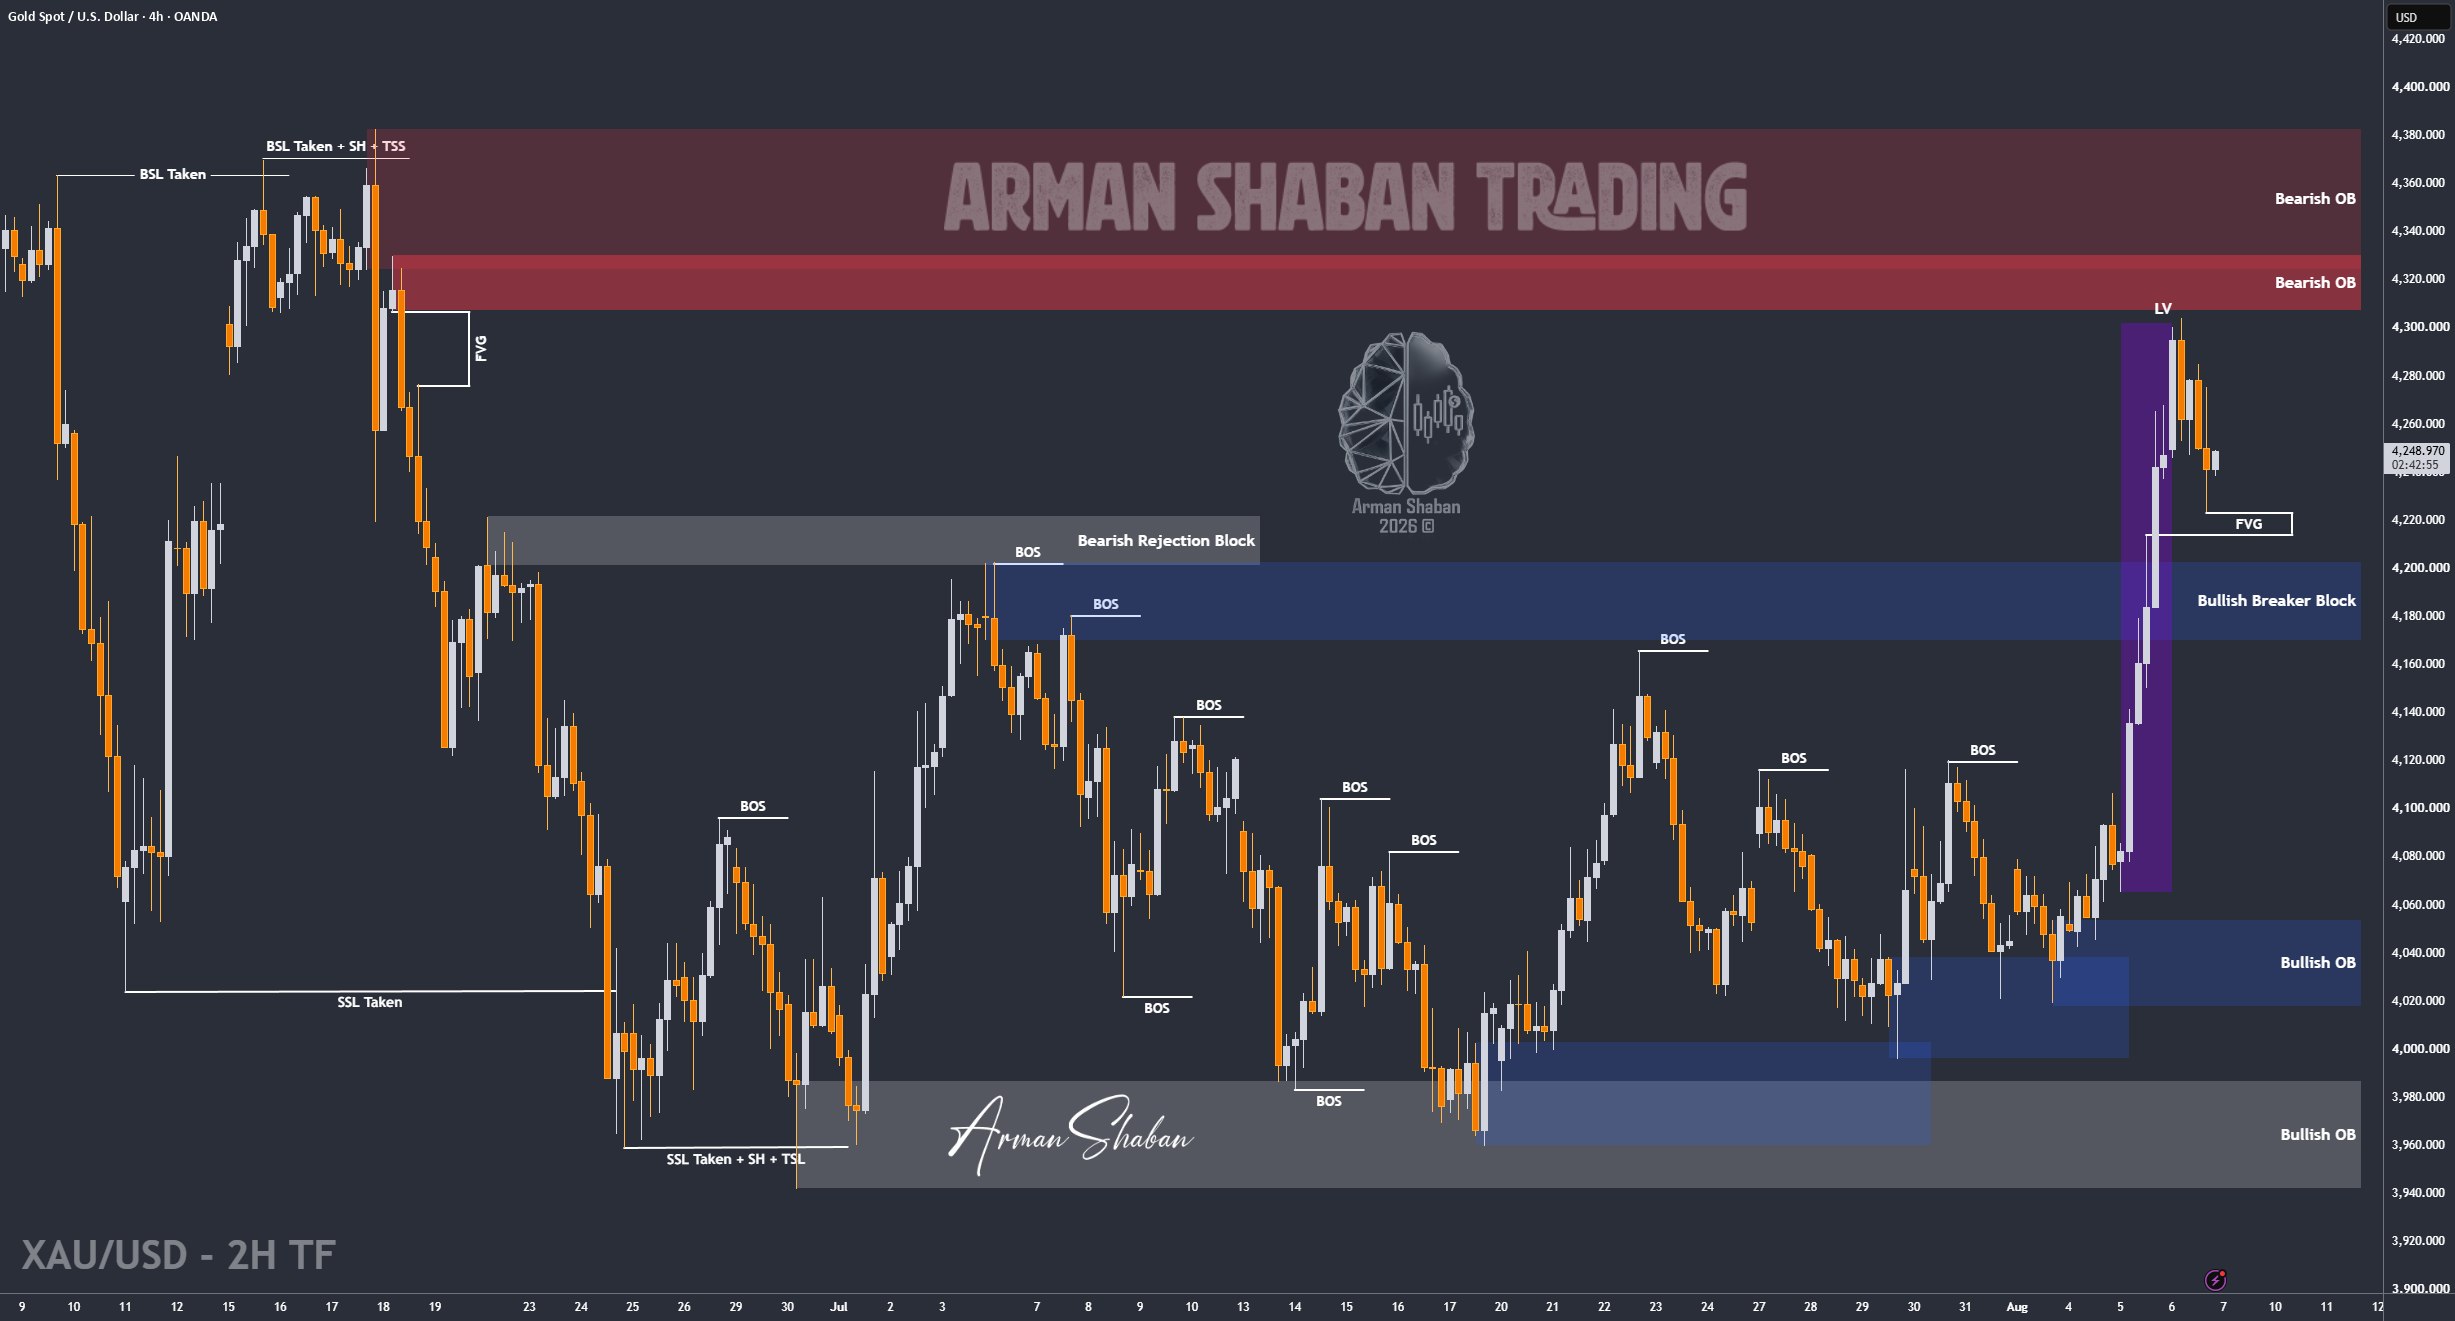
Gold Analysis: By analyzing the #Gold chart on the 2H timeframe, we can see that price continued its bullish move today and rallied as high as the $4300 region. After reaching that level, Gold entered a corrective phase and dropped toward $4223. However, buyers stepped in again and price managed to recover back toward the $4248 area.
At this stage, I still expect further upside from Gold, but there are several important zones that should be monitored closely for the next move. The first key area is the FVG between $4213 and $4224. In my view, this gap could get fully filled, and if that happens, the market may react positively from there, making this a very important demand zone to watch.
The second major area is the Bullish Breaker Block between $4169 and $4203, which is another strong demand zone on the chart. The other important demand areas are already marked on the chart, and the supply zones are also clearly highlighted. In my view, all of those supply areas remain attractive for potential sell setups depending on price reaction.
Make sure to study the chart carefully and monitor how price behaves around these levels. If you have any questions, feel free to leave a comment on this post and I’ll guide you here.
(This Post on TradingView)
Author : Arman Shaban
To see more analyzes of Gold , Forex Pairs , Cryptocurrencies , Indices and Stocks , be sure to Follow and Join us on other Platforms :
– Public Telegram Channel
– YouTube Channel
– TradingView
– X (Twitter)
– How to join our FOREX VIP Channel ?
– How to join our Crypto VIP Channel ?
– CONTACT ME directly on Telegram

