Gold Analysis – 24.Jul.2026
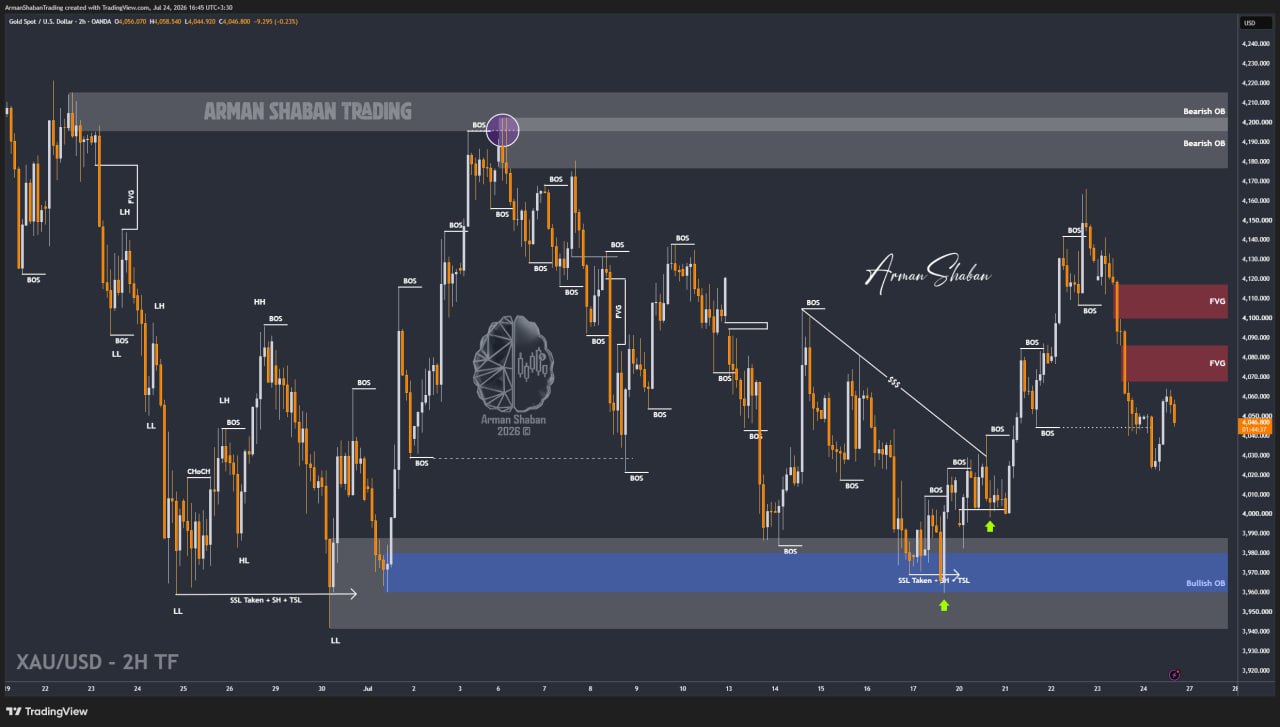
Gold Analysis: By analyzing the #Gold chart on the 2H timeframe, we can see that after the previous analysis, price continued lower and reached the $4021 region.
After that decline, buyers stepped in and pushed Gold back toward $4063. However, this recovery remained limited and price has started correcting again. Gold is currently trading around $4047.
In my view, this recovery looks more like a temporary pullback before another stronger bearish move. If Gold breaks below $4021 and stabilizes under this level, the probability of a deeper decline will increase significantly.
The next downside targets to monitor are $4000, followed by $3980, then $3960, $3940, and potentially $3900 if selling pressure continues to build.
For now, my main bias remains bearish, and the reaction around $4021 will be the key confirmation for the next move.
(This Post on TradingView)
Author : Arman Shaban
To see more analyzes of Gold , Forex Pairs , Cryptocurrencies , Indices and Stocks , be sure to Follow and Join us on other Platforms :
– Public Telegram Channel
– YouTube Channel
– TradingView
– X (Twitter)
– How to join our FOREX VIP Channel ?
– How to join our Crypto VIP Channel ?
– CONTACT ME directly on Telegram

