Gold Analysis – 22.Jul.2026
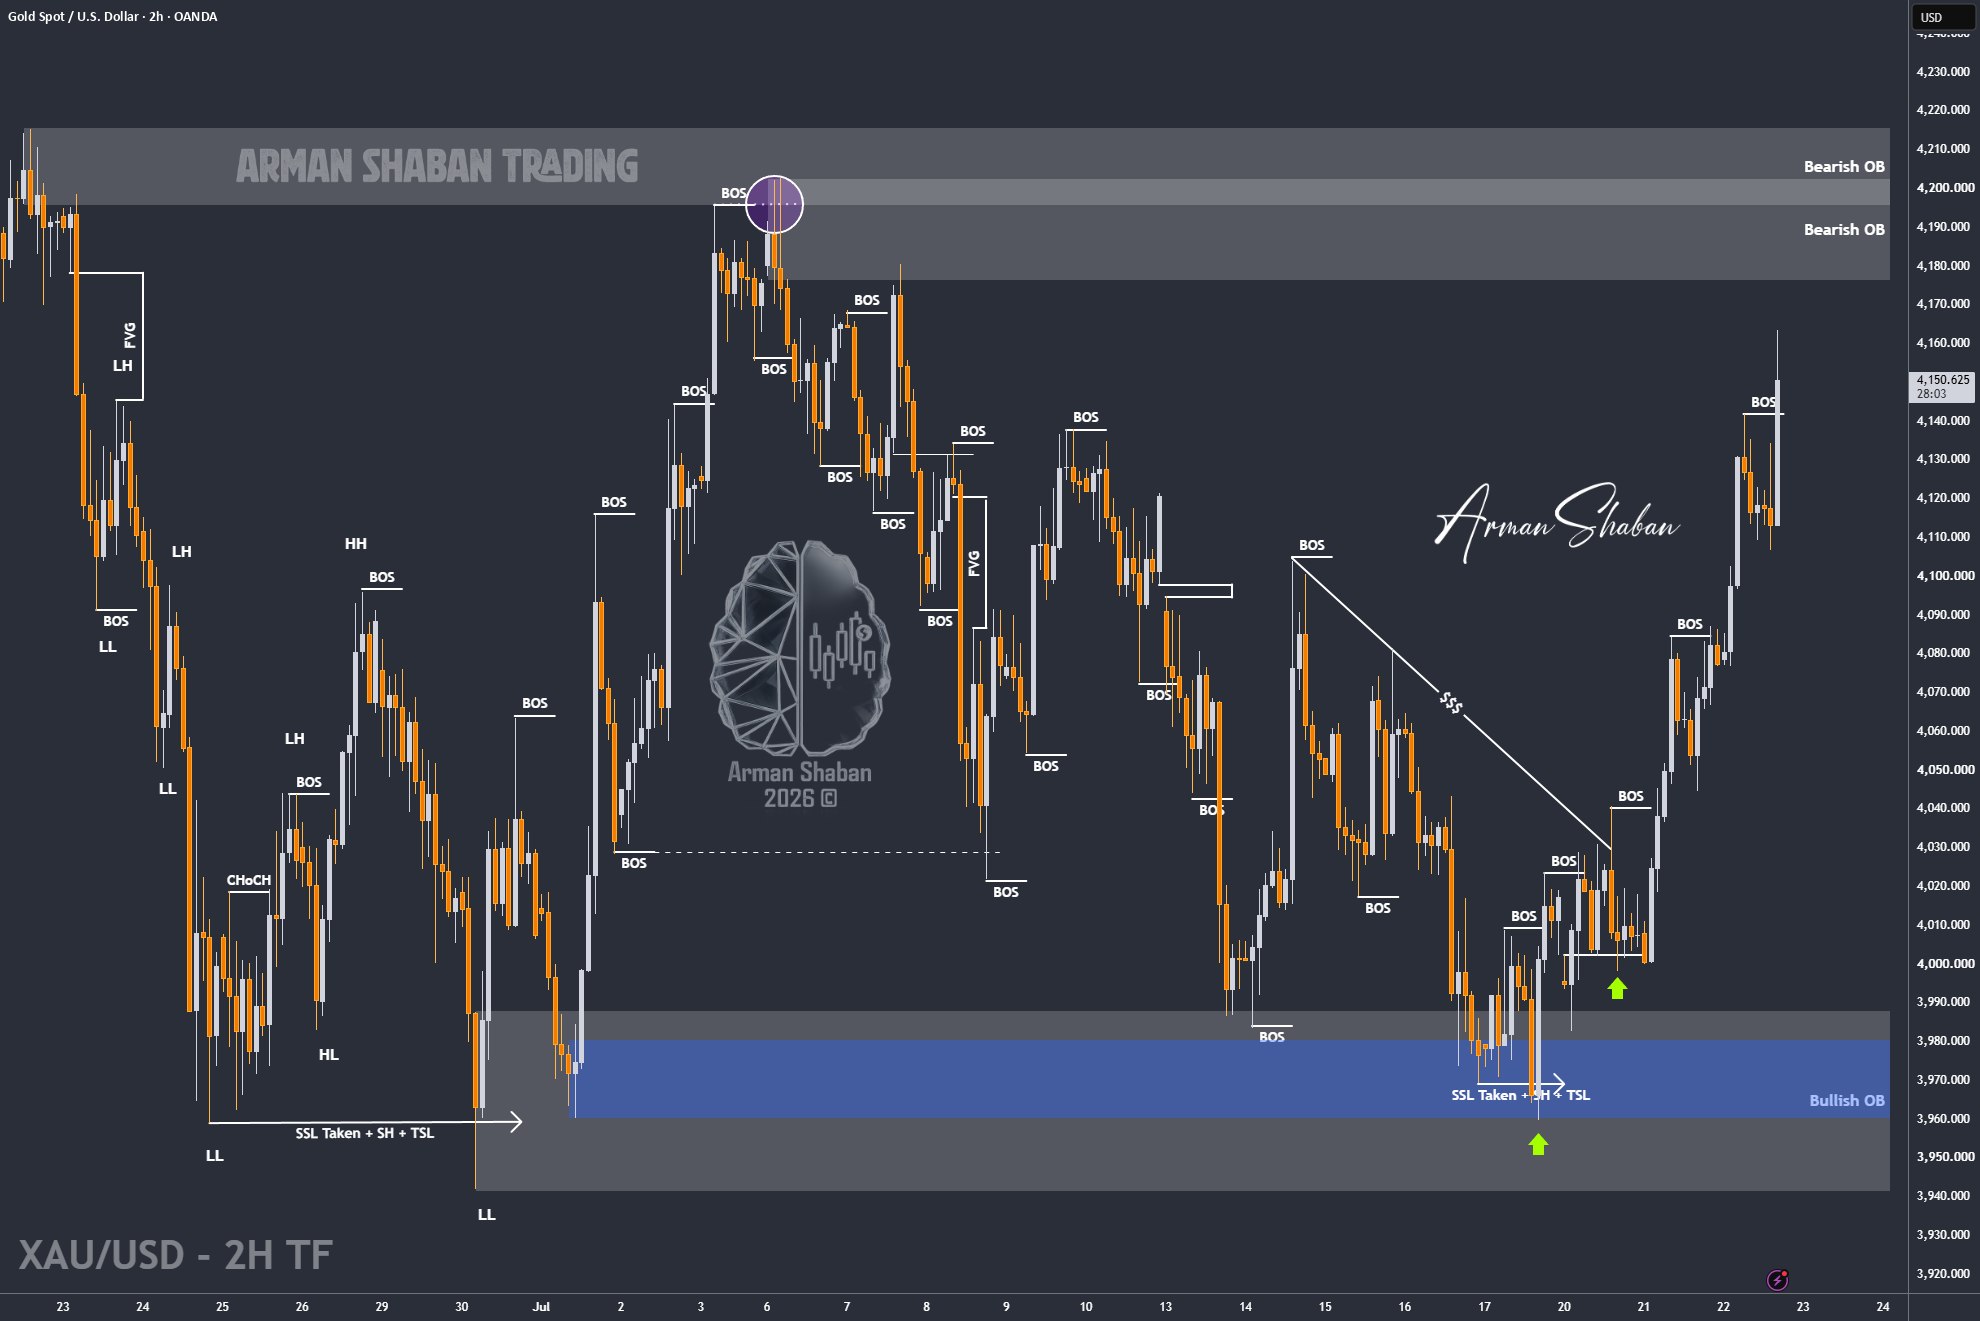
Gold Analysis: By analyzing the #Gold chart on the 2H timeframe, we can see that today’s price action was highly unusual. With Oil rallying toward $95, tensions around the Strait of Hormuz continuing to increase, and the conflict involving Iran escalating, Gold also delivered an exceptional bullish move toward $4163.
For the first time in several months, Gold is showing a noticeably strong positive correlation with Oil, as both markets react aggressively to the latest geopolitical developments.
Given the current volatility, I do not want to discuss a fixed directional scenario in this update. For now, the focus should remain only on the key supply and demand levels and the reactions that develop around them.
The important supply zones are located around $4172 – $4182, followed by $4188 – $4202, and then $4215 – $4222.
On the downside, the important demand levels and potential buying areas to monitor are around $4062, followed by $4038 and $4020.
These areas can be monitored for both buying and selling setups, but only after a clear price reaction and with proper risk management.
(This Post on TradingView)
Author : Arman Shaban
To see more analyzes of Gold , Forex Pairs , Cryptocurrencies , Indices and Stocks , be sure to Follow and Join us on other Platforms :
– Public Telegram Channel
– YouTube Channel
– TradingView
– X (Twitter)
– How to join our FOREX VIP Channel ?
– How to join our Crypto VIP Channel ?
– CONTACT ME directly on Telegram

