Gold Analysis – 21.Sep.2026
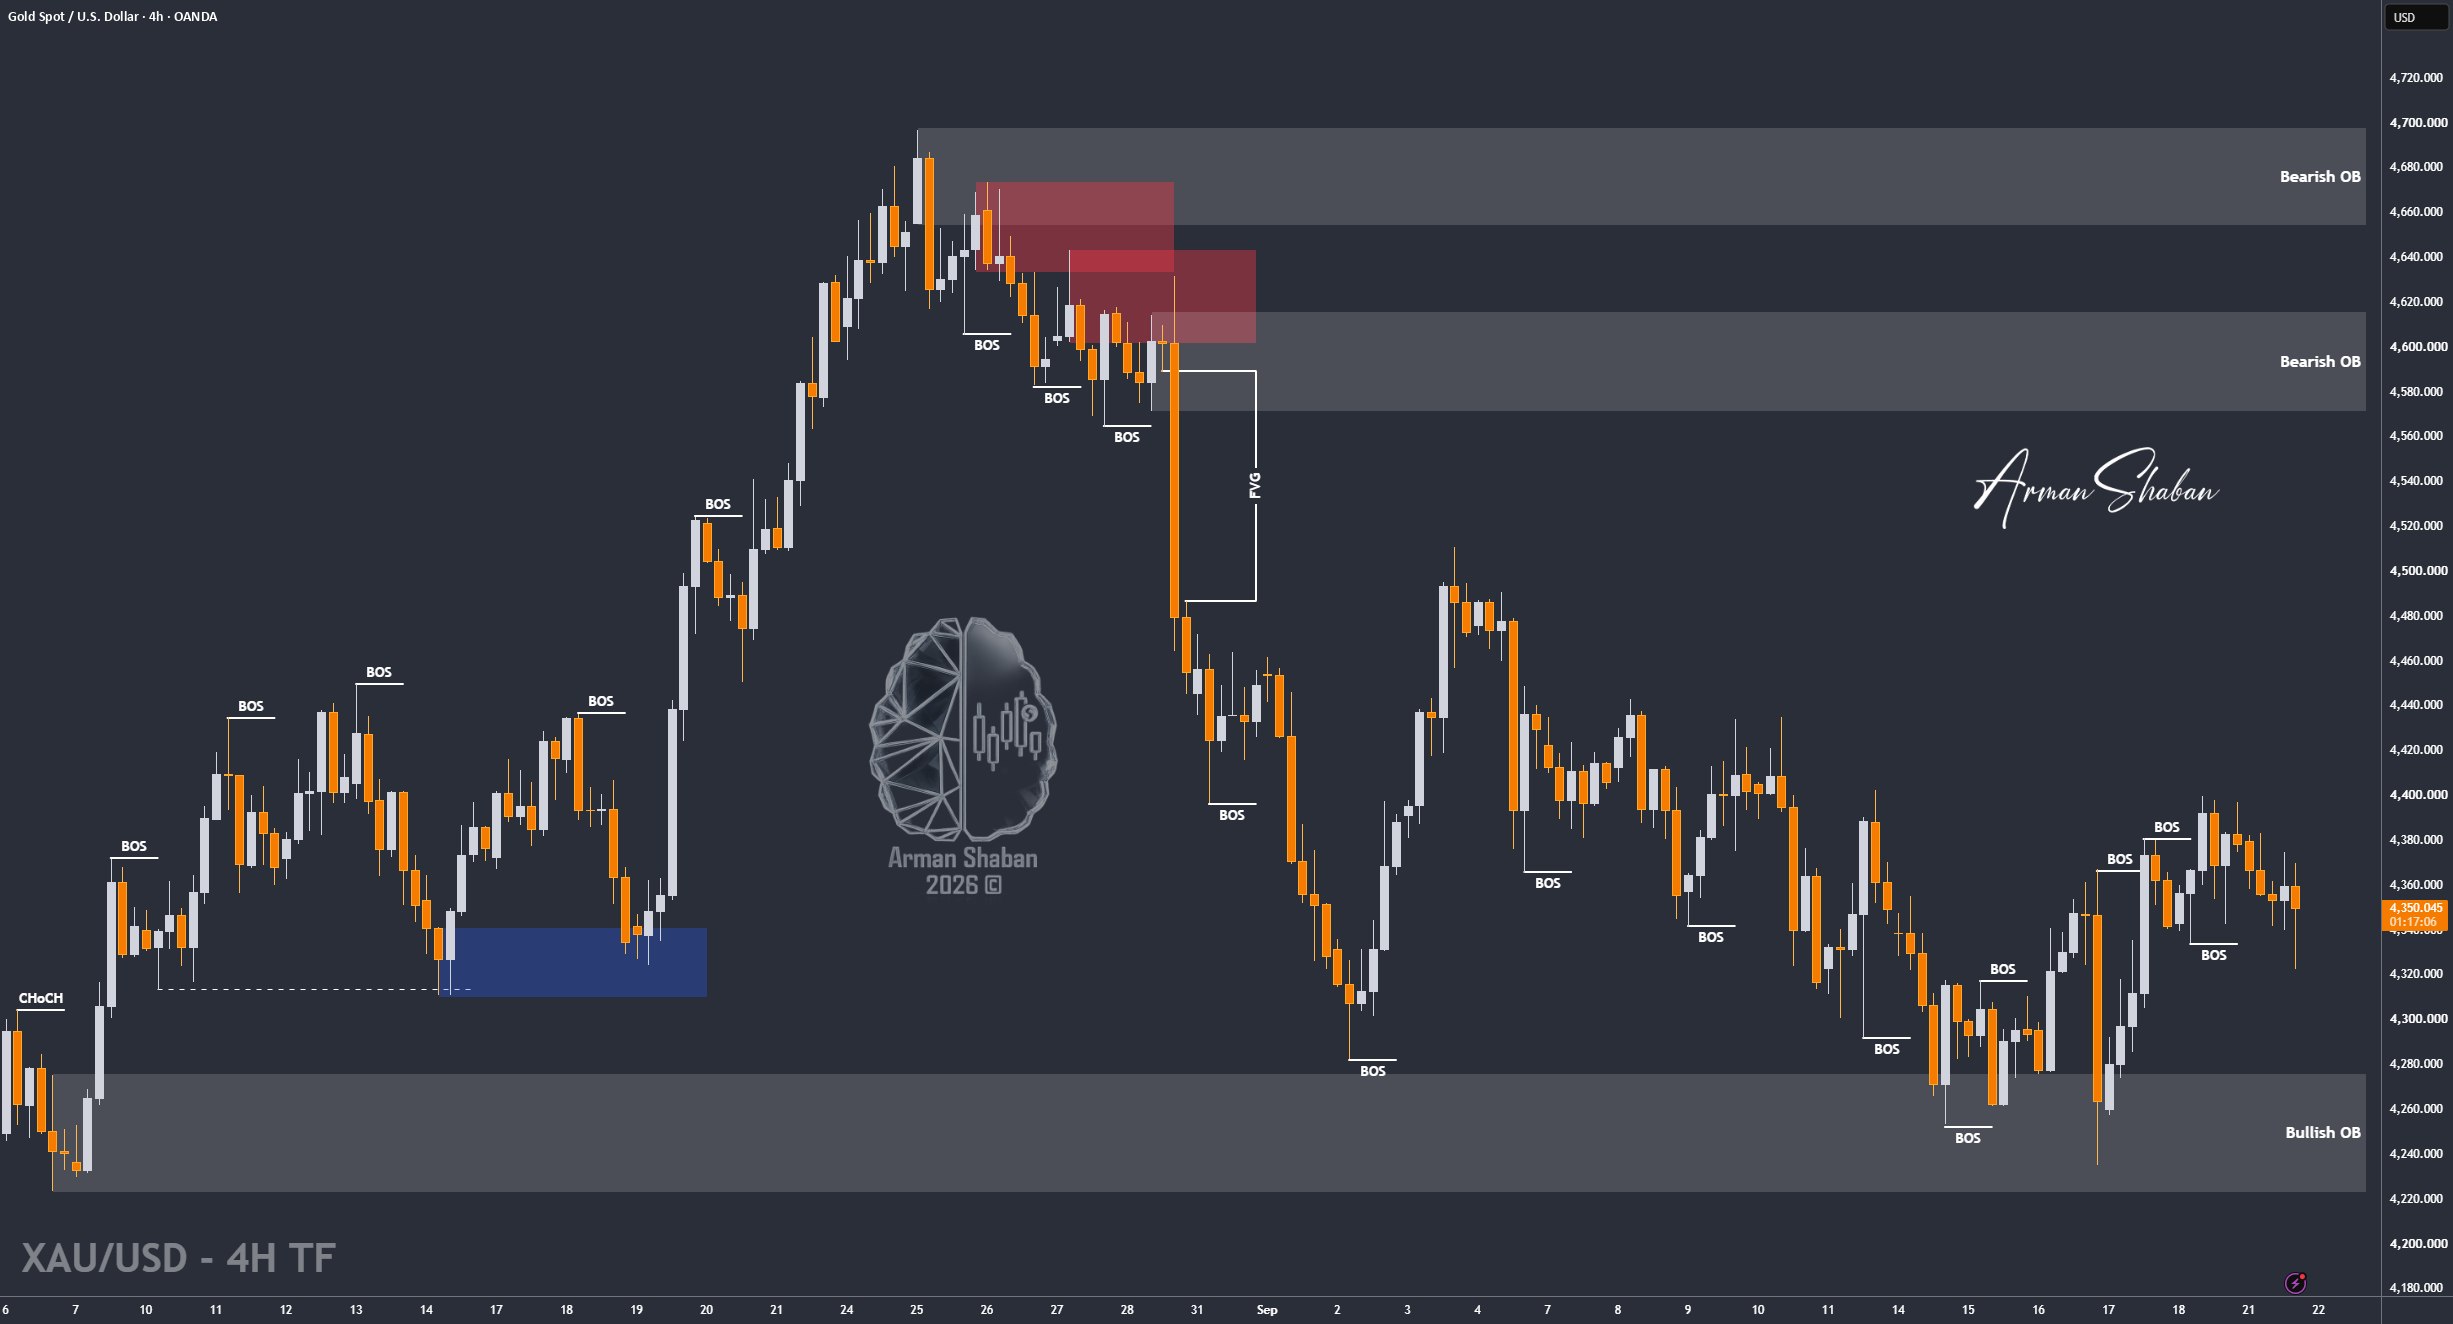
Gold Analysis: By analyzing the #Gold chart on the 4H timeframe, we can see that after the previous analysis, price rallied toward $4397 but failed to maintain its momentum. With the new weekly session, selling pressure increased and Gold dropped as low as $4322.
Currently, Gold is trading around $4351. My outlook is relatively neutral, but I’m leaning toward another bearish move as long as buyers fail to reclaim the nearby resistance levels.
The nearest supply zones are around $4360 – $4380, followed by $4390 – $4400. On the downside, the important demand zones are $4310 – $4330, followed by $4250 – $4285 and $4224 – $4240.
If Gold breaks below $4322 and closes a 4H candle underneath this level, the next downside targets I’m watching are $4300, $4285, $4250, $4224 and potentially $4200.
For now, my short-term bias is slightly bearish, but I want to see confirmation below $4322 before expecting a stronger sell-off.
(This Post on TradingView)
Author : Arman Shaban
To see more analyzes of Gold , Forex Pairs , Cryptocurrencies , Indices and Stocks , be sure to Follow and Join us on other Platforms :
– Public Telegram Channel
– YouTube Channel
– TradingView
– X (Twitter)
– How to join our FOREX VIP Channel ?
– How to join our Crypto VIP Channel ?
– CONTACT ME directly on Telegram

