Gold Analysis – 20.Jul.2026
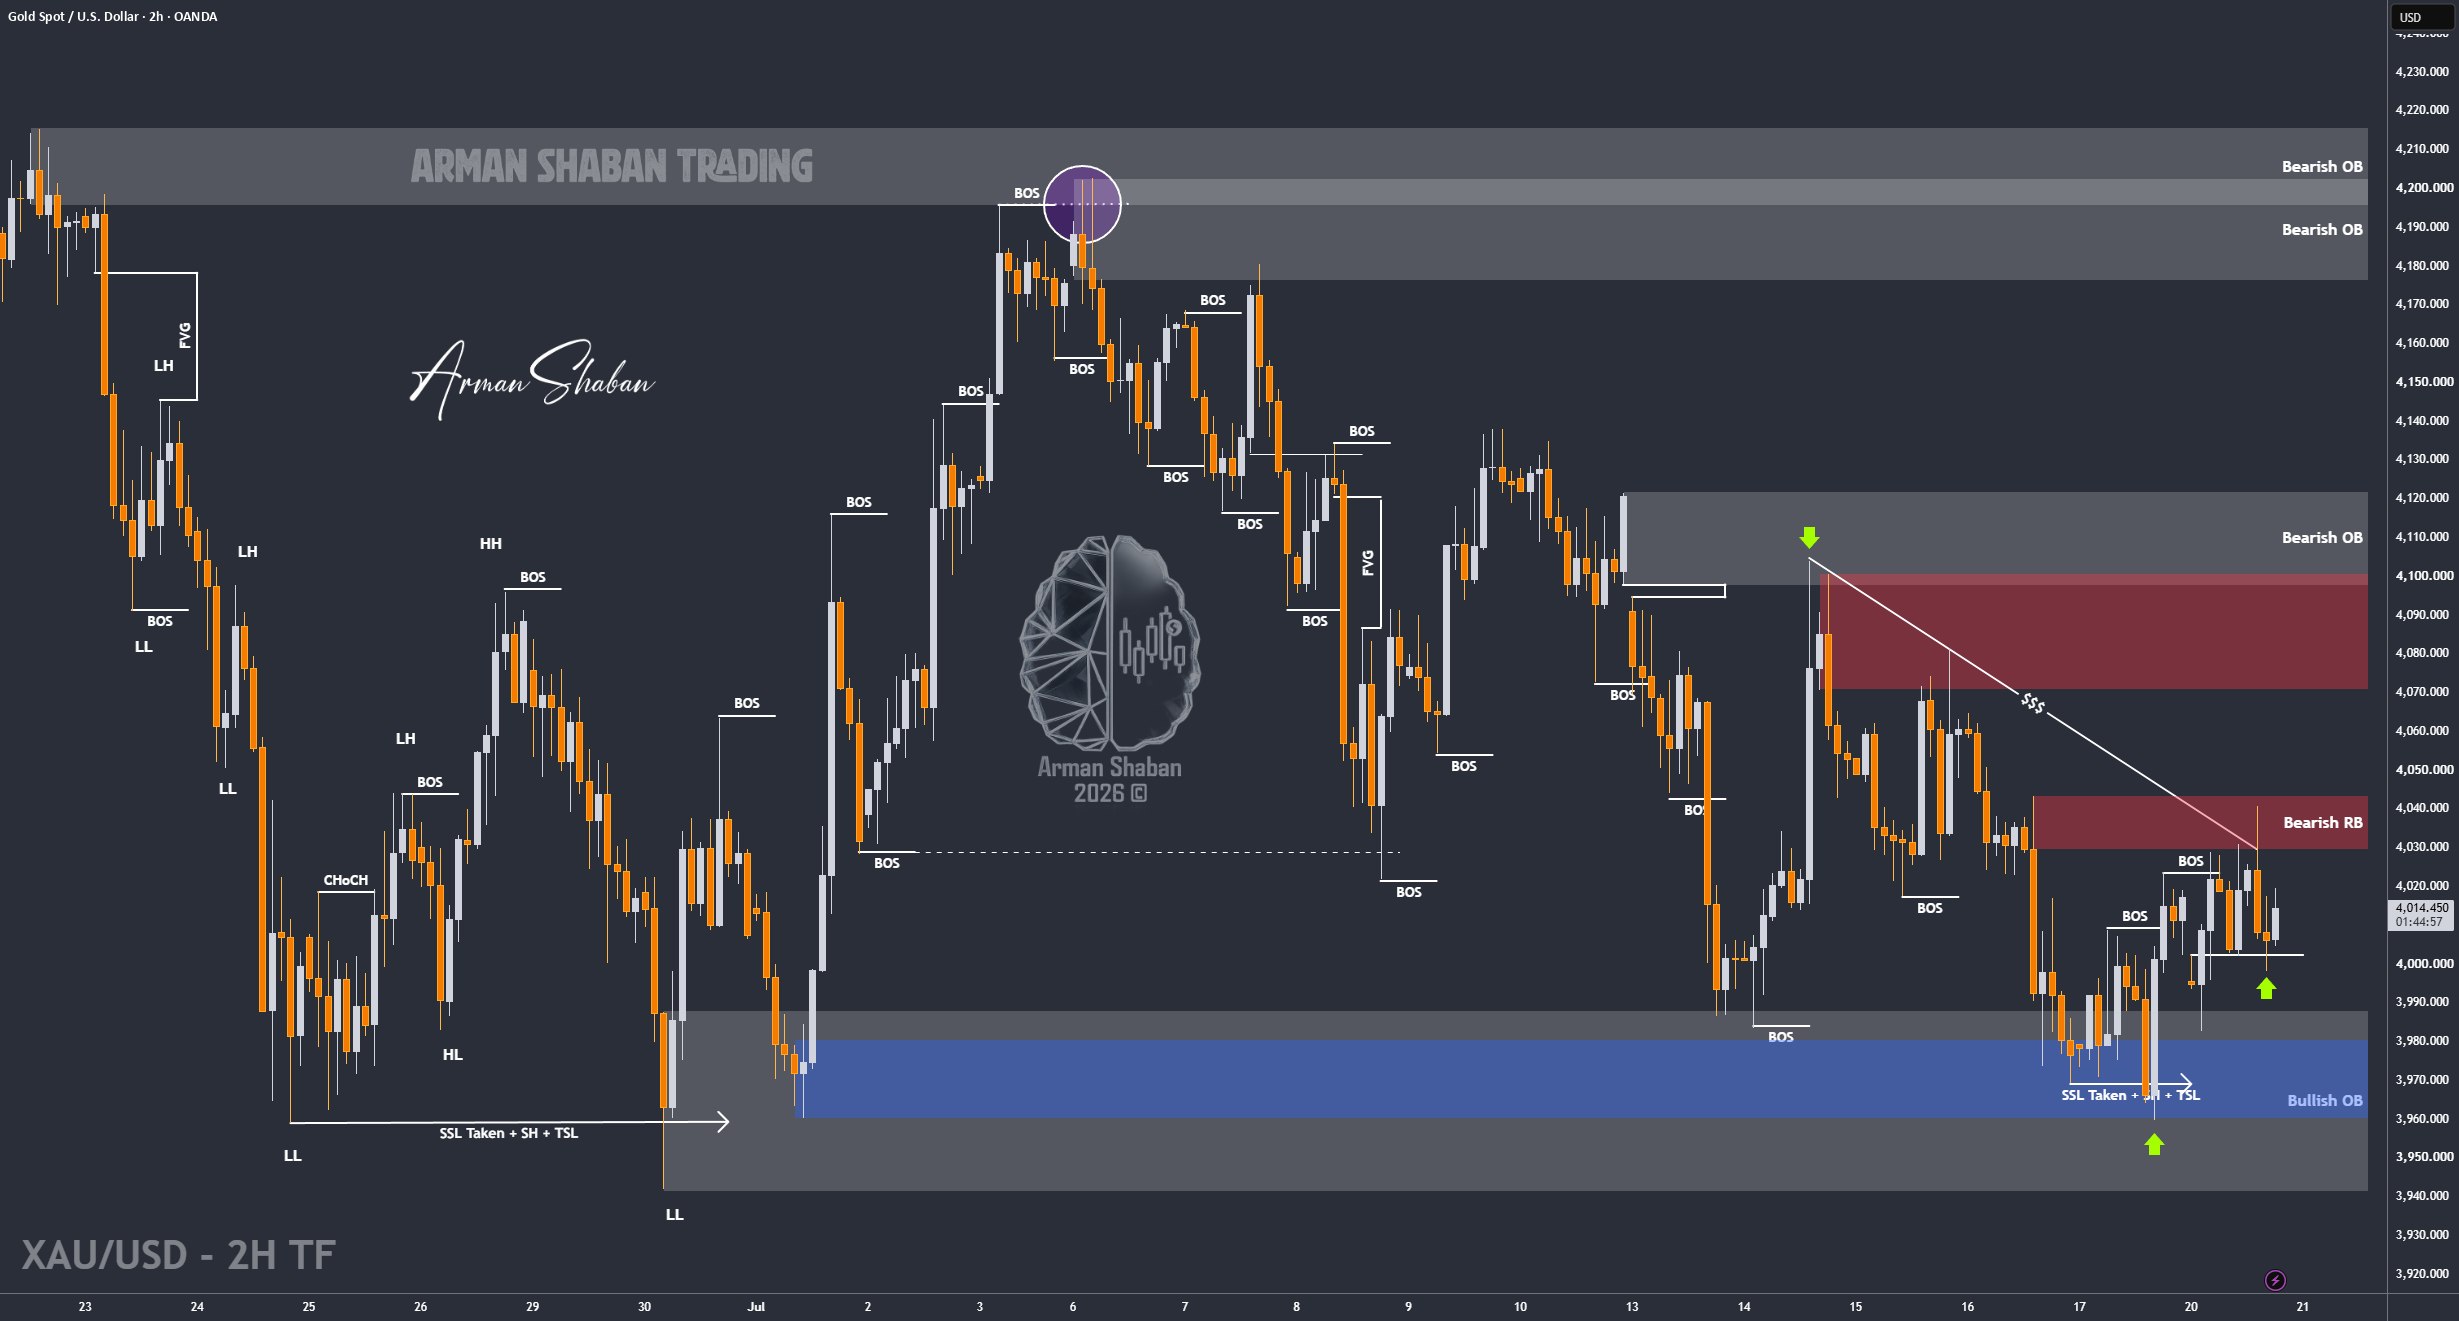
Gold Analysis: By analyzing the #Gold chart on the 2H timeframe, we can see that after the previous update, price first dropped toward $3959 and swept the liquidity resting below $3969.
After this liquidity sweep, buyers stepped in and pushed Gold higher toward the important $4040 supply zone. Once price reached this area, sellers became active again and pushed Gold back down toward $3999.
Currently, Gold is trading around $4020. In my view, this bullish move is more likely to remain a temporary correction rather than the beginning of a larger recovery.
The nearest supply zones are located around $4023 – $4040, followed by the stronger resistance area between $4060 – $4080. On the downside, the closest demand zones are around $3990 – $4000, followed by $3958 – $3970 and deeper support between $3935 – $3950.
I still expect another stronger bearish wave to begin soon. A clear stabilization below the psychological $4000 level would increase the probability of further downside toward the lower demand and liquidity zones.
Gold’s recent price action has become extremely unstable and difficult to trade. However, our approach remains unchanged: focus on the important levels, manage risk properly, and always use a clear stop-loss. For now, my main bias remains bearish.
(This Post on TradingView)
Author : Arman Shaban
To see more analyzes of Gold , Forex Pairs , Cryptocurrencies , Indices and Stocks , be sure to Follow and Join us on other Platforms :
– Public Telegram Channel
– YouTube Channel
– TradingView
– X (Twitter)
– How to join our FOREX VIP Channel ?
– How to join our Crypto VIP Channel ?
– CONTACT ME directly on Telegram

