Bitcoin Analysis – 12.Aug.2026
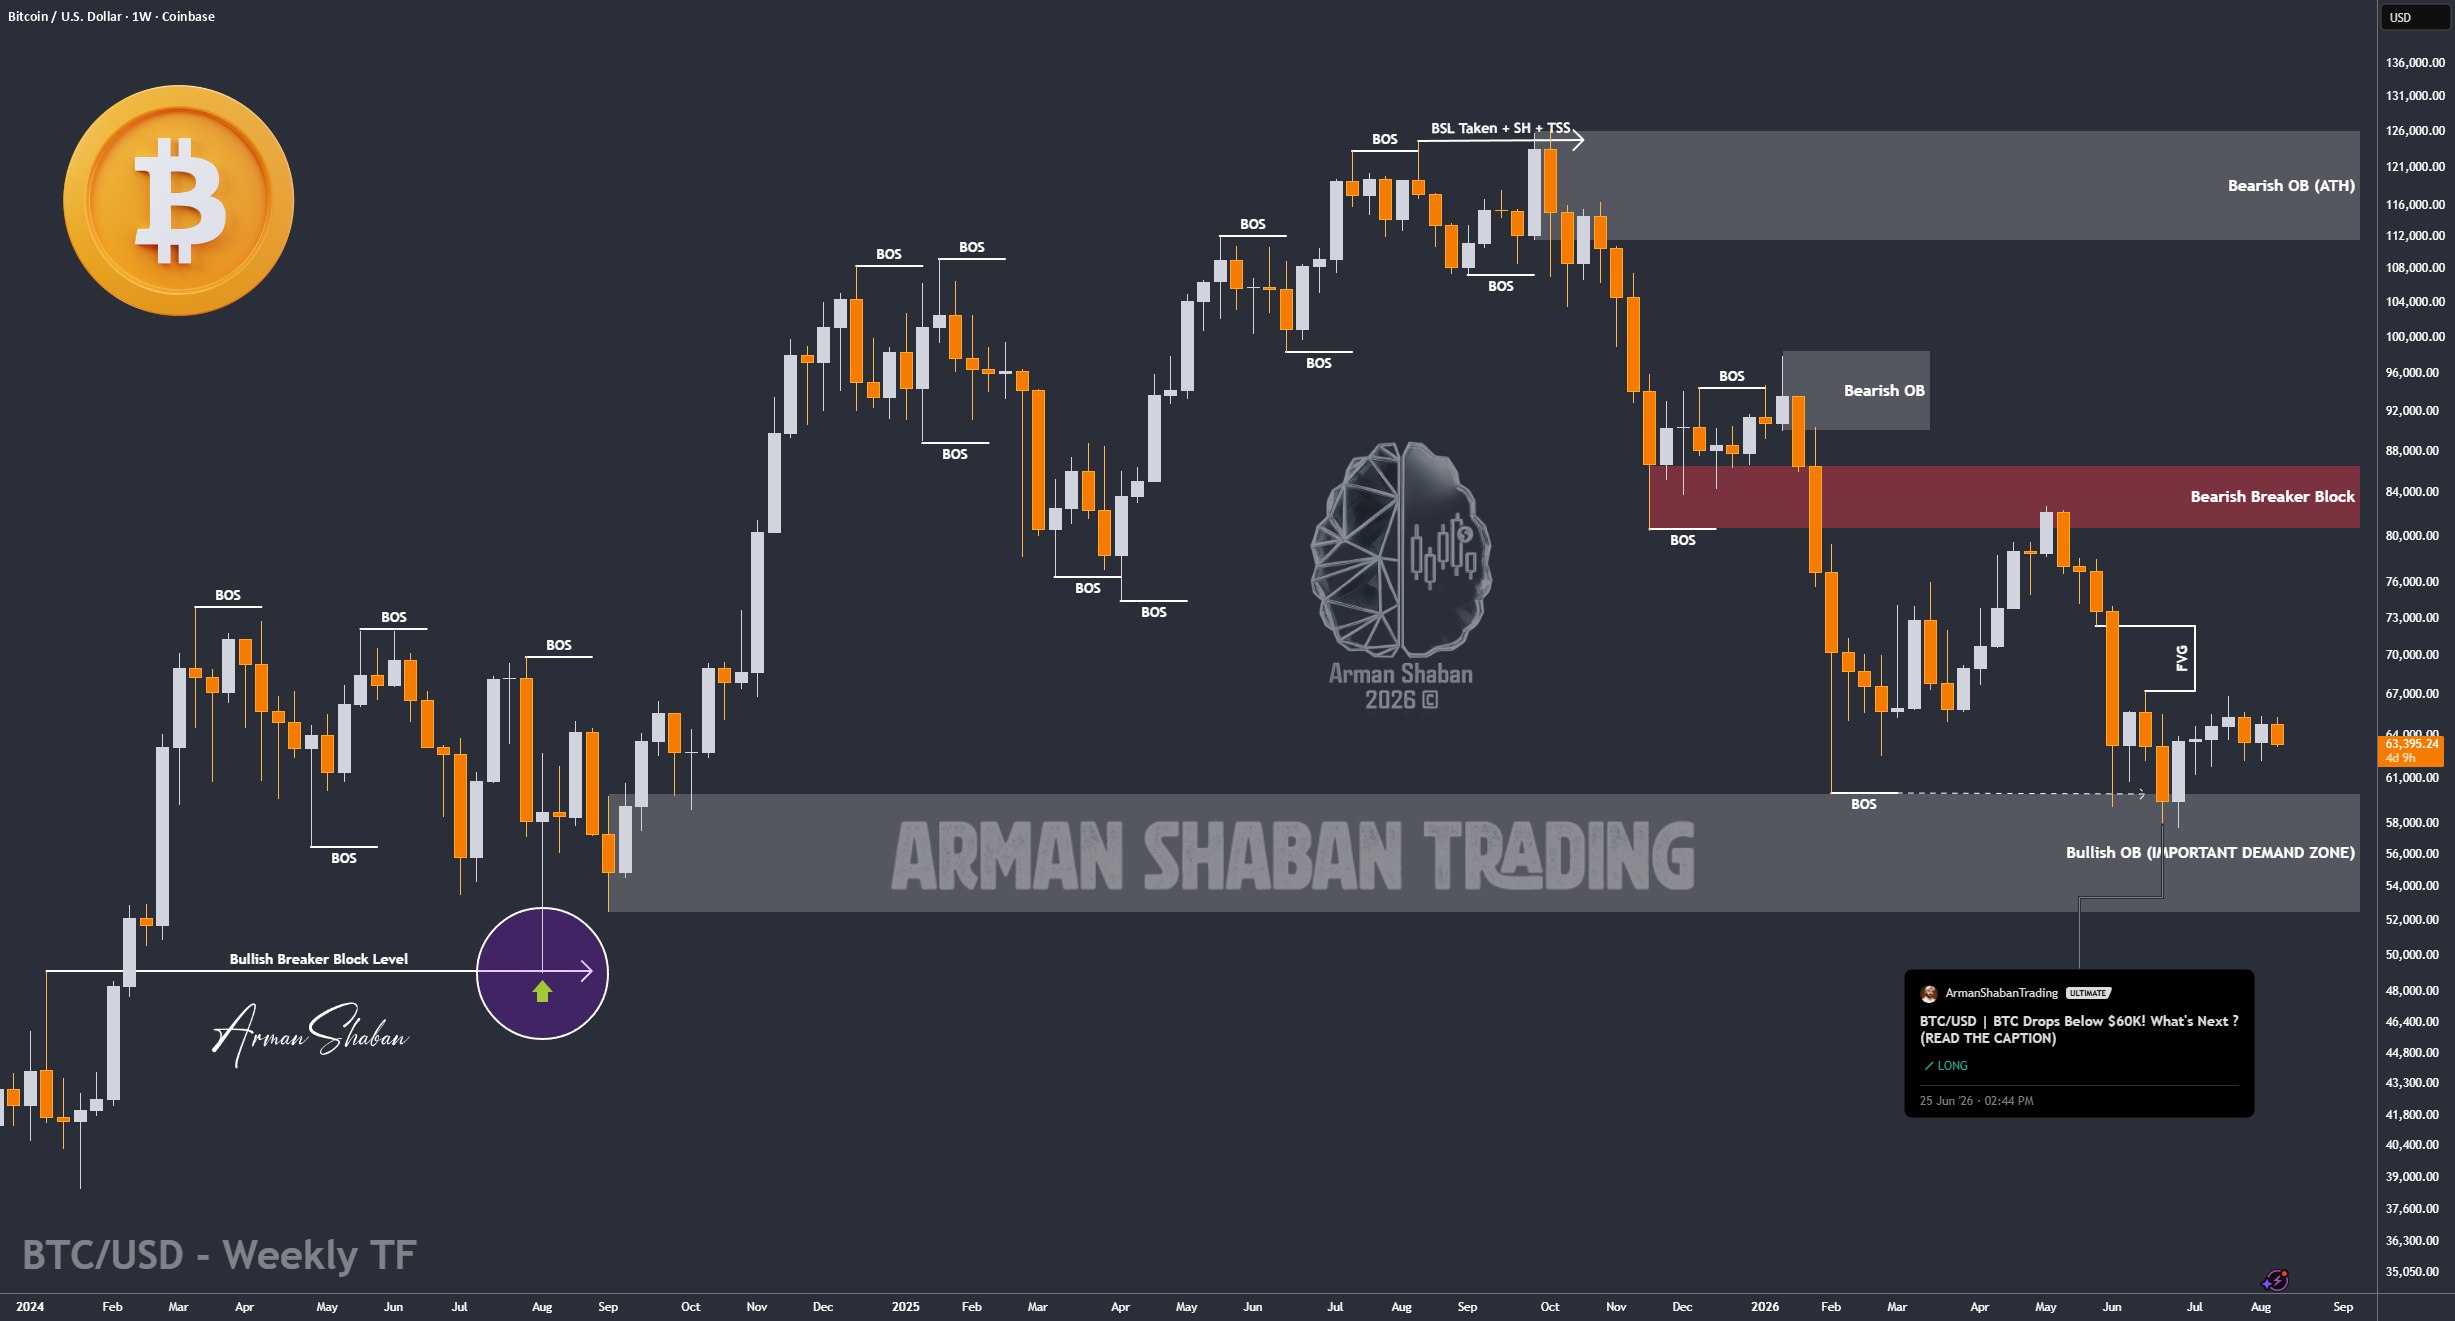
Bitcoin Analysis: By analyzing the #Bitcoin chart on the weekly timeframe, we can see that BTC has been trading around the $60K area for almost 10 weeks without establishing a clear directional trend.
This kind of market can become extremely boring, but many times the real move begins exactly when most traders lose patience. Currently, Bitcoin is trading around $63,500 and, in my view, the main scenario has not changed. I still expect a bullish move from this broader accumulation area.
The most important demand zone on the chart remains the Bullish Order Block around $52,500 – $60,000. Inside the current structure, the $60,000 – $62,000 area is also an important short-term support. A deeper structural level can be found around the Bullish Breaker near $48,000 – $50,000.
On the upside, the first important area is the FVG around $67,000 – $73,000. Above that, the major Bearish Breaker Block is located around $81,000 – $87,000, followed by the Bearish OB around $90,000 – $96,000. The major long-term supply zone remains the ATH Bearish OB around $112,000 – $126,000.
If buyers finally regain momentum, the next upside targets I’m watching are $67,000, $70,000, $73,000, followed by $81,000 – $84,000. If the broader bullish expansion develops, $90,000 – $96,000 would become the next major objective.
For now, nothing has materially changed in my outlook. Bitcoin is still holding its major demand area, and I continue to expect higher prices once this long consolidation finally ends.
(This Post on TradingView)
Author : Arman Shaban
To see more analyzes of Gold , Forex Pairs , Cryptocurrencies , Indices and Stocks , be sure to Follow and Join us on other Platforms :
– Public Telegram Channel
– YouTube Channel
– TradingView
– X (Twitter)
– How to join our FOREX VIP Channel ?
– How to join our Crypto VIP Channel ?
– CONTACT ME directly on Telegram

