USD/JPY Analysis – 22.Jul.2026
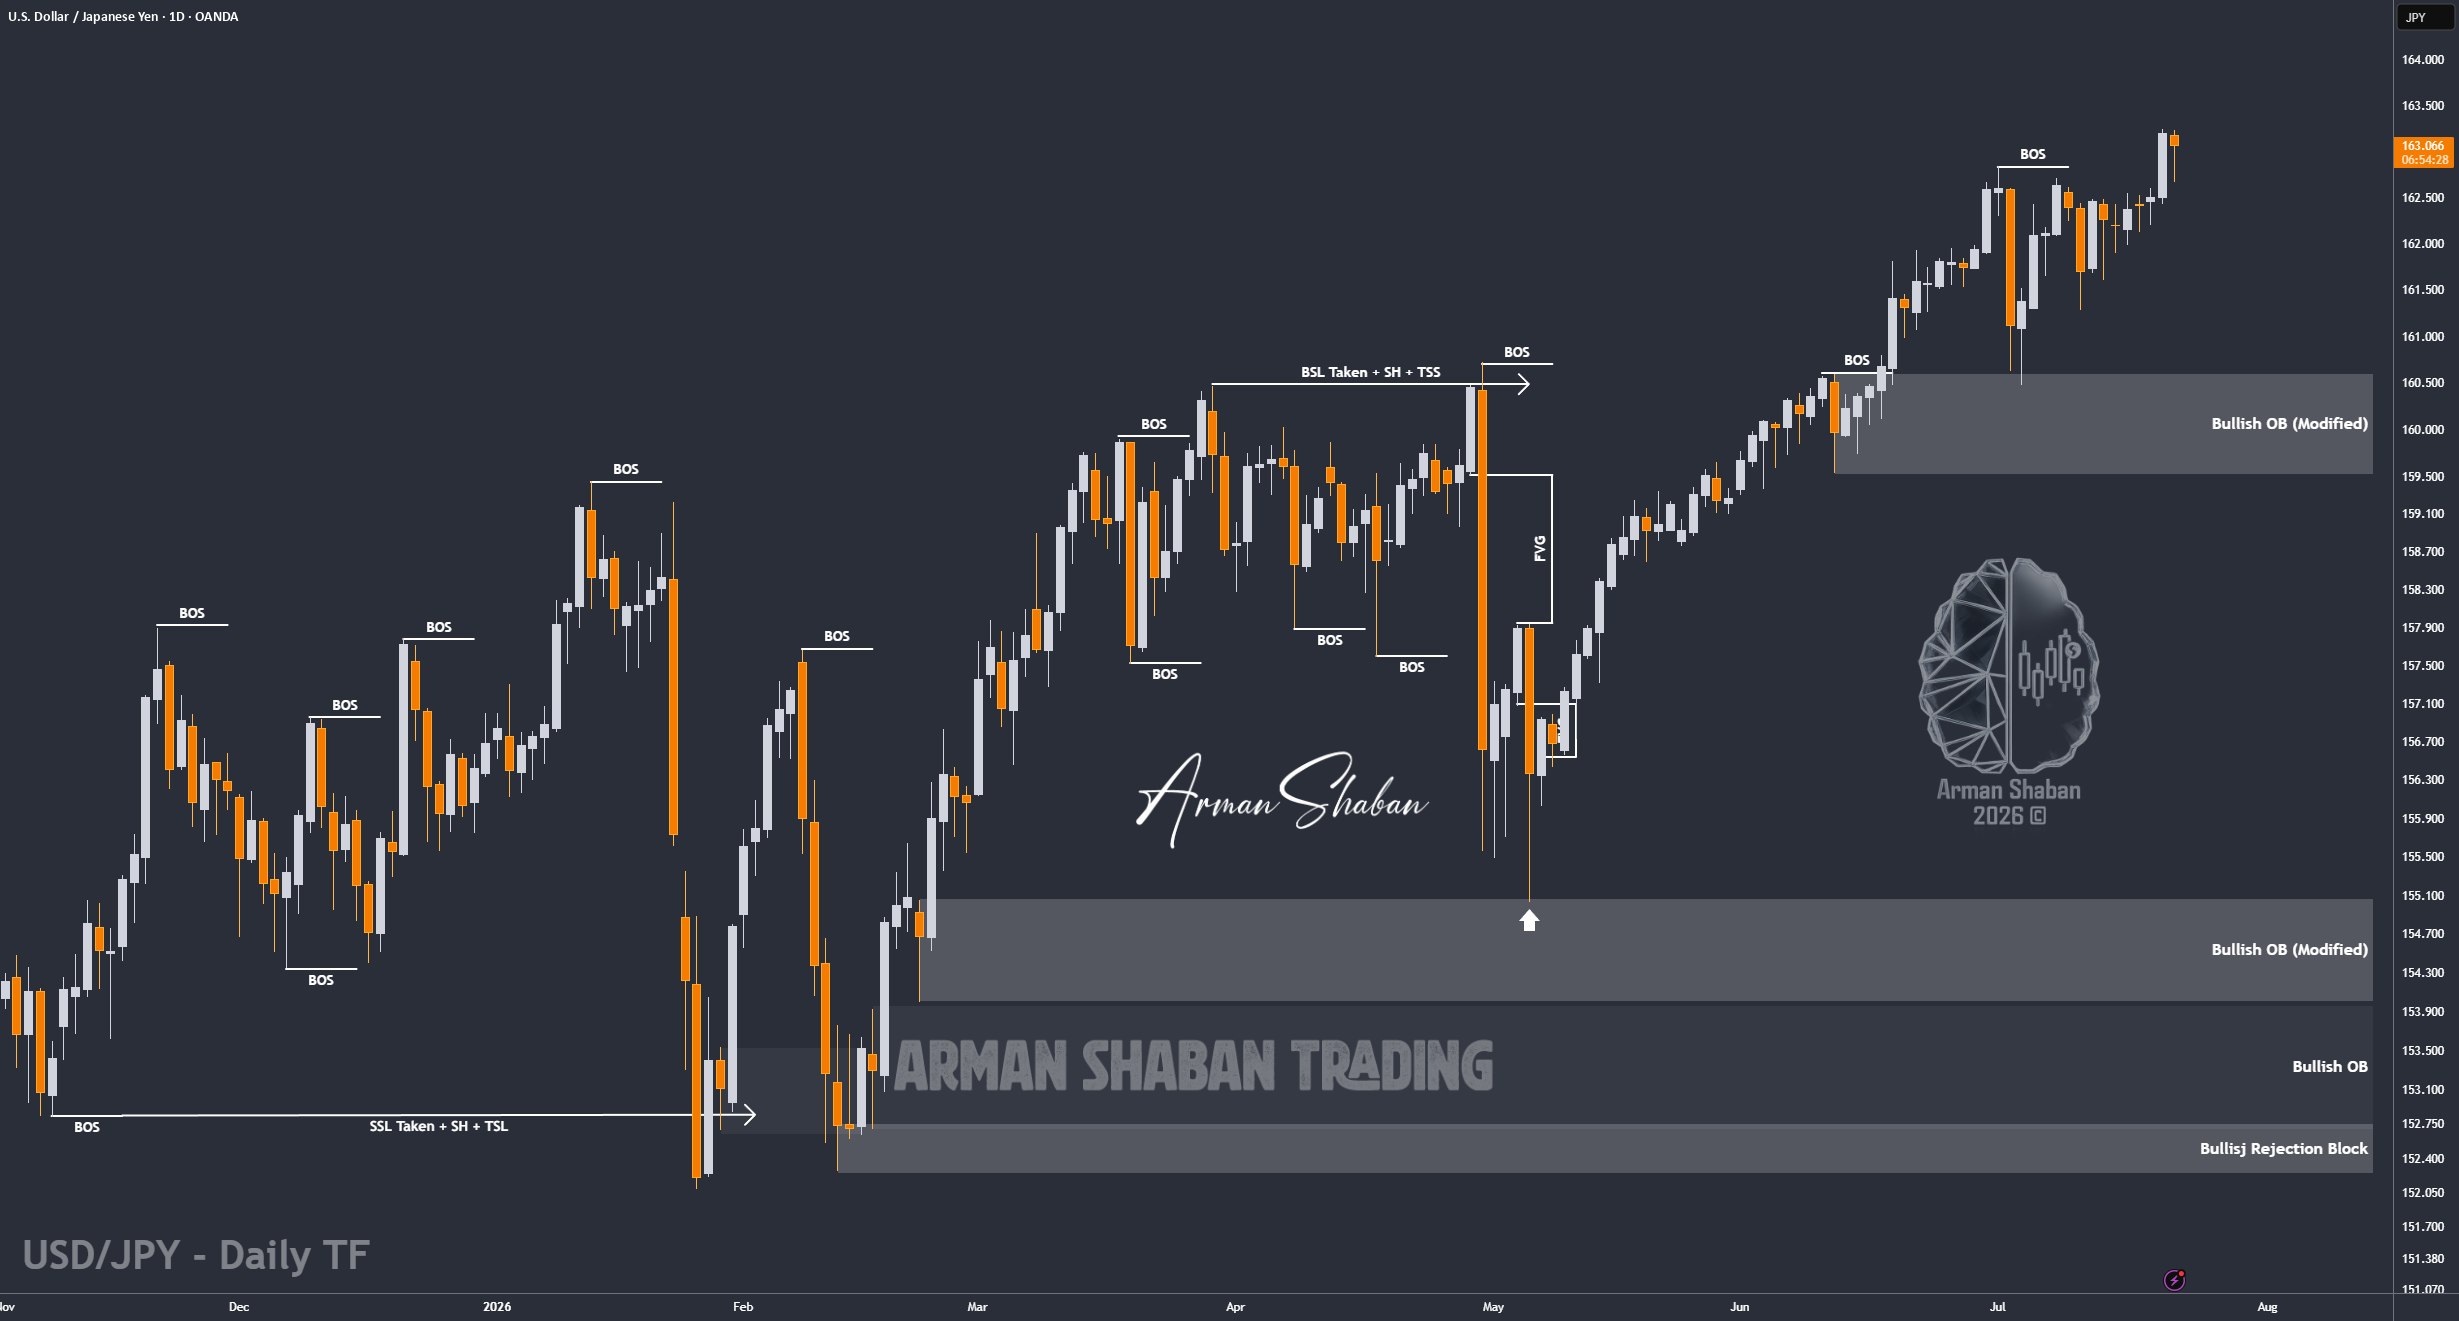
USD/JPY Analysis : By analyzing the #USDJPY chart on the Daily timeframe, we can see that price continued its strong bullish move and reached the 163.24 region, marking another multi-decade high.
After this move, USDJPY entered a minor correction, but buyers quickly stepped back in and price is currently trading around the 163.00 level. With the Japanese Yen still under heavy pressure and the U.S. Dollar remaining strong across the broader market, I continue to expect further upside.
The nearest demand zones are located around 162.20 – 162.60, followed by stronger support between 161.40 – 161.80. On the upside, the closest supply zone is around 163.20 – 163.60, followed by stronger resistance between 164.20 – 164.80.
If buyers manage to break and stabilize above the recent 163.24 high, the next upside targets to monitor are 163.60, followed by 164.20, then 165.00, and potentially 166.00 if bullish momentum continues.
For now, the broader structure remains bullish as long as price continues holding above the key demand zones.
(This Post on TradingView)
Author : Arman Shaban
To see more analyzes of Gold , Forex Pairs , Cryptocurrencies , Indices and Stocks , be sure to Follow and Join us on other Platforms :
– Public Telegram Channel
– YouTube Channel
– TradingView
– X (Twitter)
– How to join our FOREX VIP Channel ?
– How to join our Crypto VIP Channel ?
– CONTACT ME directly on Telegram

