Gold Analysis – 12.Jun.2026
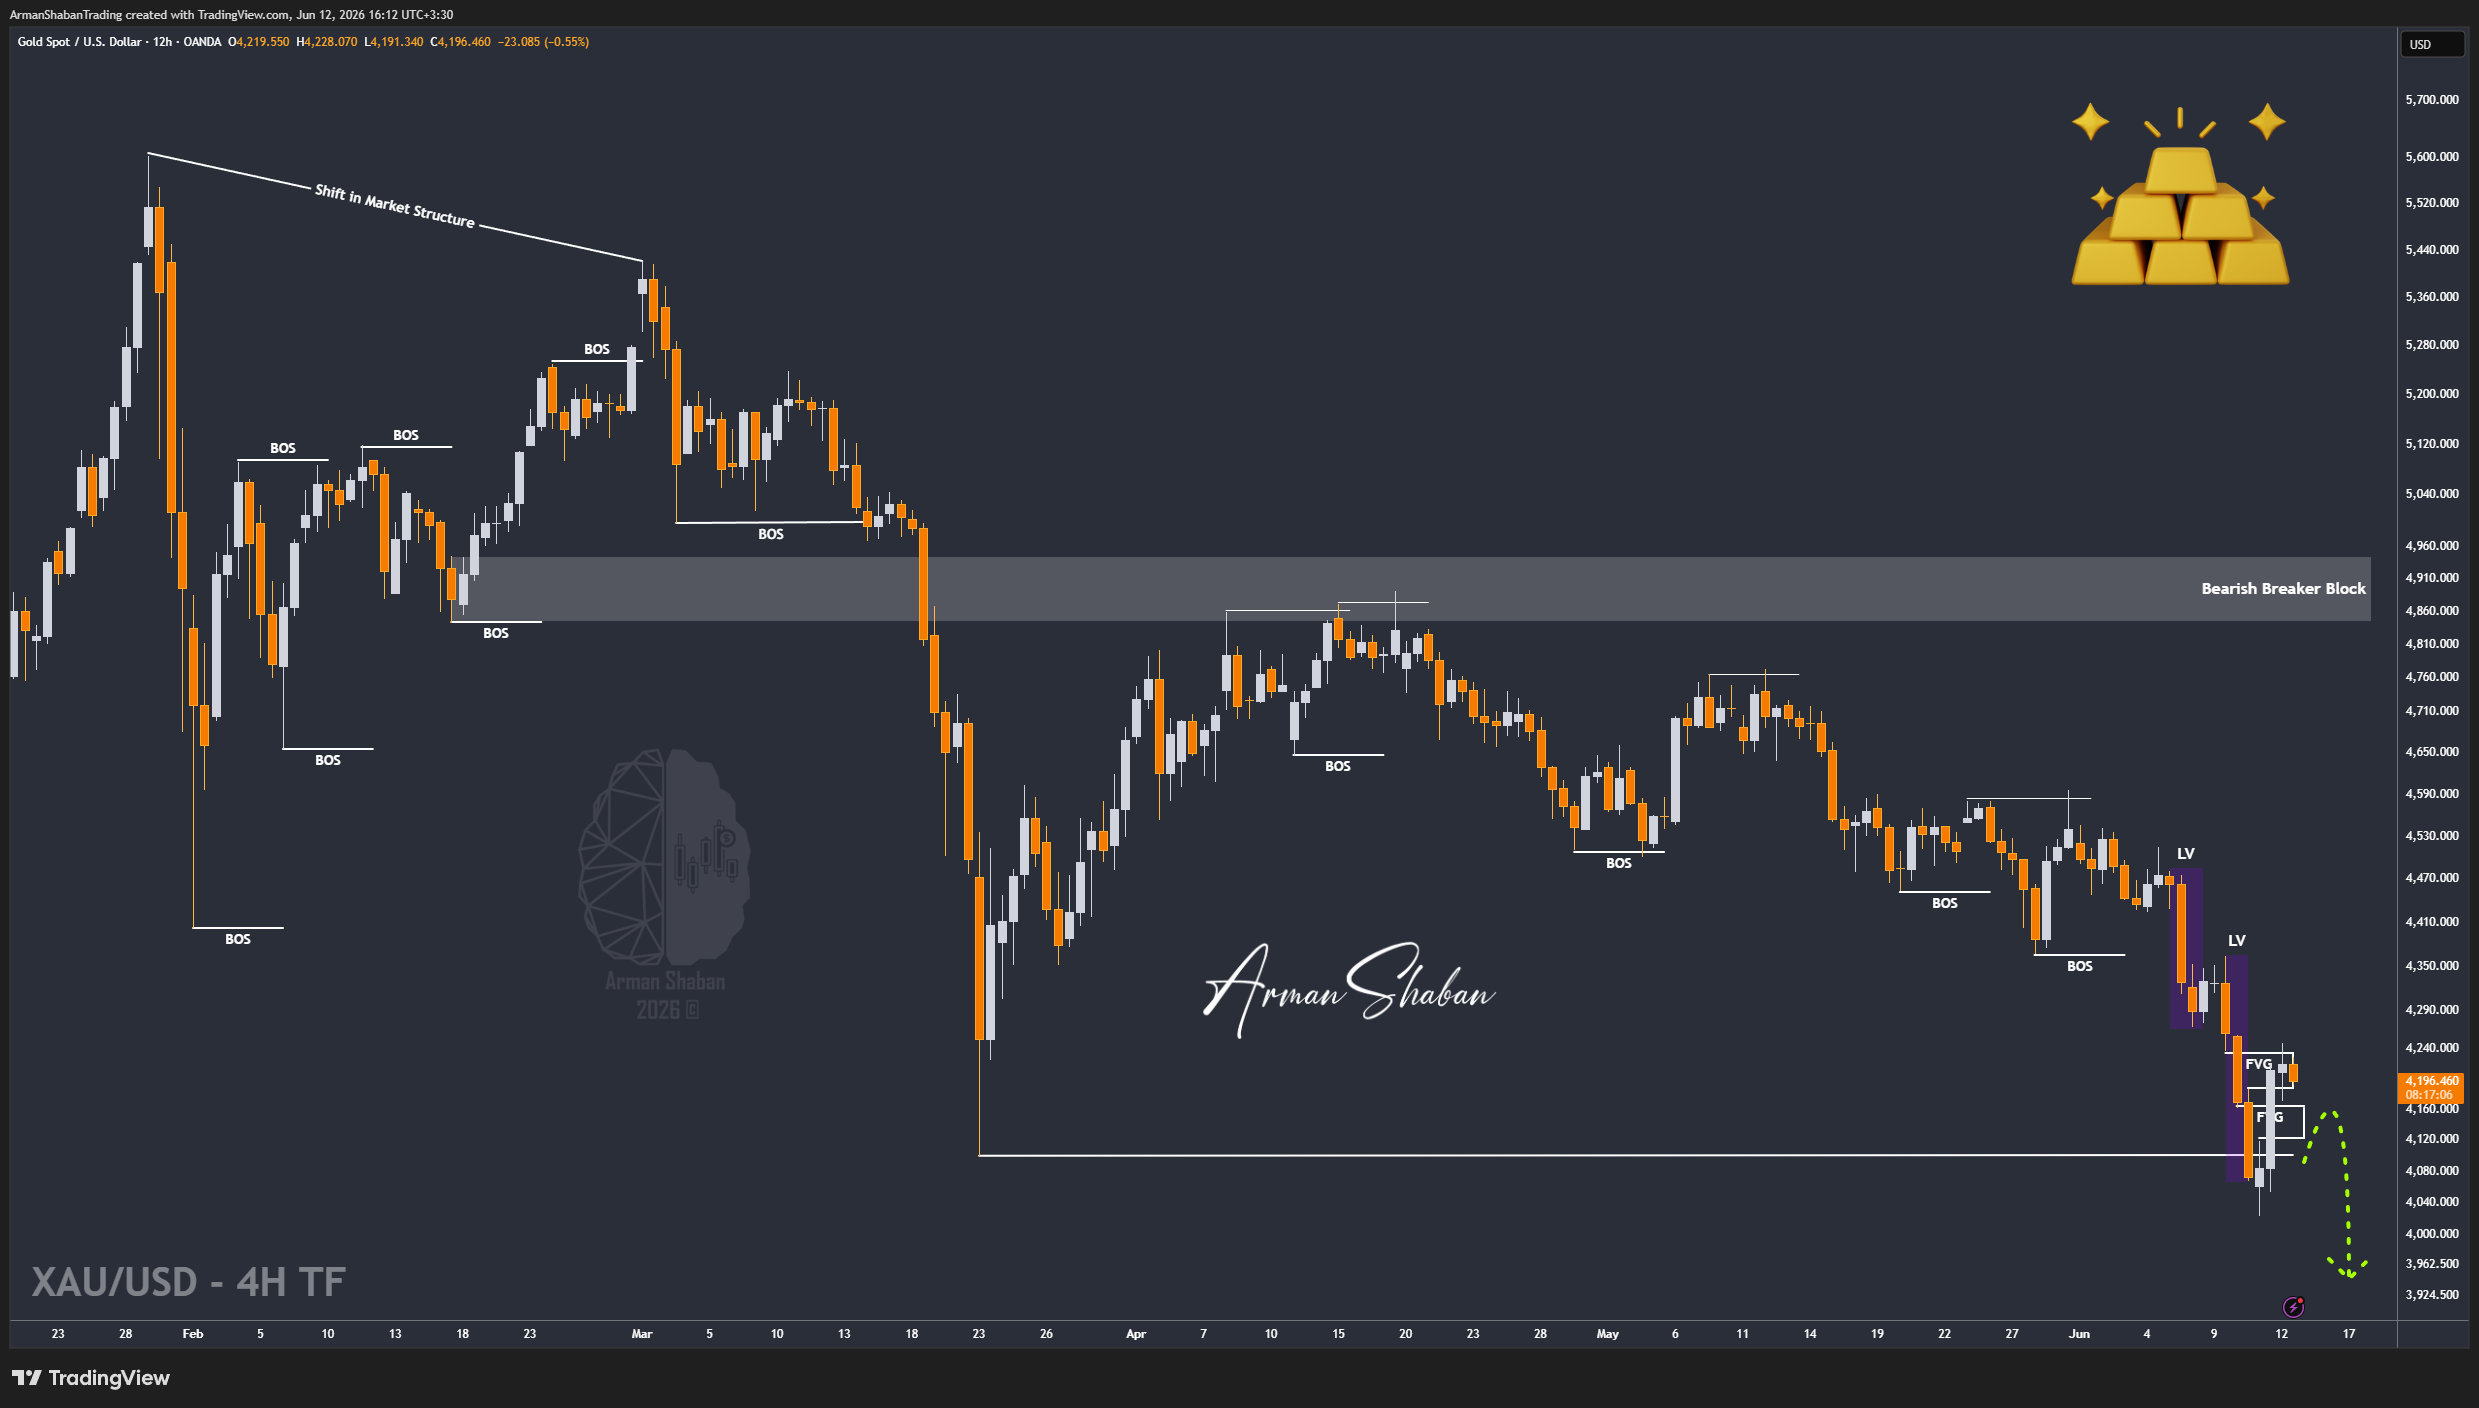
Gold Analysis: By analyzing the #Gold chart on the 4H timeframe, we can see that price once again respected the scenario discussed in our previous update. Before any deeper correction could develop, comments from Trump triggered a strong rebound and Gold rallied from around $4,080 all the way up to $4,246.
More importantly, this rally successfully filled both Fair Value Gaps that we highlighted in the previous analysis. After completing those imbalances, Gold reacted exactly as expected and sellers regained control, pushing price back down toward the $4,200 region.
From a structural perspective, the nearest supply zones are now located around $4230 – $4260, followed by a stronger resistance cluster between $4300 – $4340. On the downside, the closest demand zones are sitting around $4180 – $4200, with deeper structural support located around $4100 – $4120.
At this stage, the key question is whether Gold can successfully stabilize below the important $4240 level. In my view, if price continues to trade below this area, the probability of another bearish leg toward lower liquidity zones remains elevated.
The next downside targets to monitor are $4150, followed by $4100, then $3999 if bearish momentum accelerates again.
For now, sellers remain in control and the broader bias continues to favor the downside. This analysis will be updated as the market evolves.
(This Post on TradingView)
Author : Arman Shaban
To see more analyzes of Gold , Forex Pairs , Cryptocurrencies , Indices and Stocks , be sure to Follow and Join us on other Platforms :
– Public Telegram Channel
– YouTube Channel
– TradingView
– X (Twitter)
– How to join our FOREX VIP Channel ?
– How to join our Crypto VIP Channel ?
– CONTACT ME directly on Telegram