Gold Analysis – 11.Jun.2026
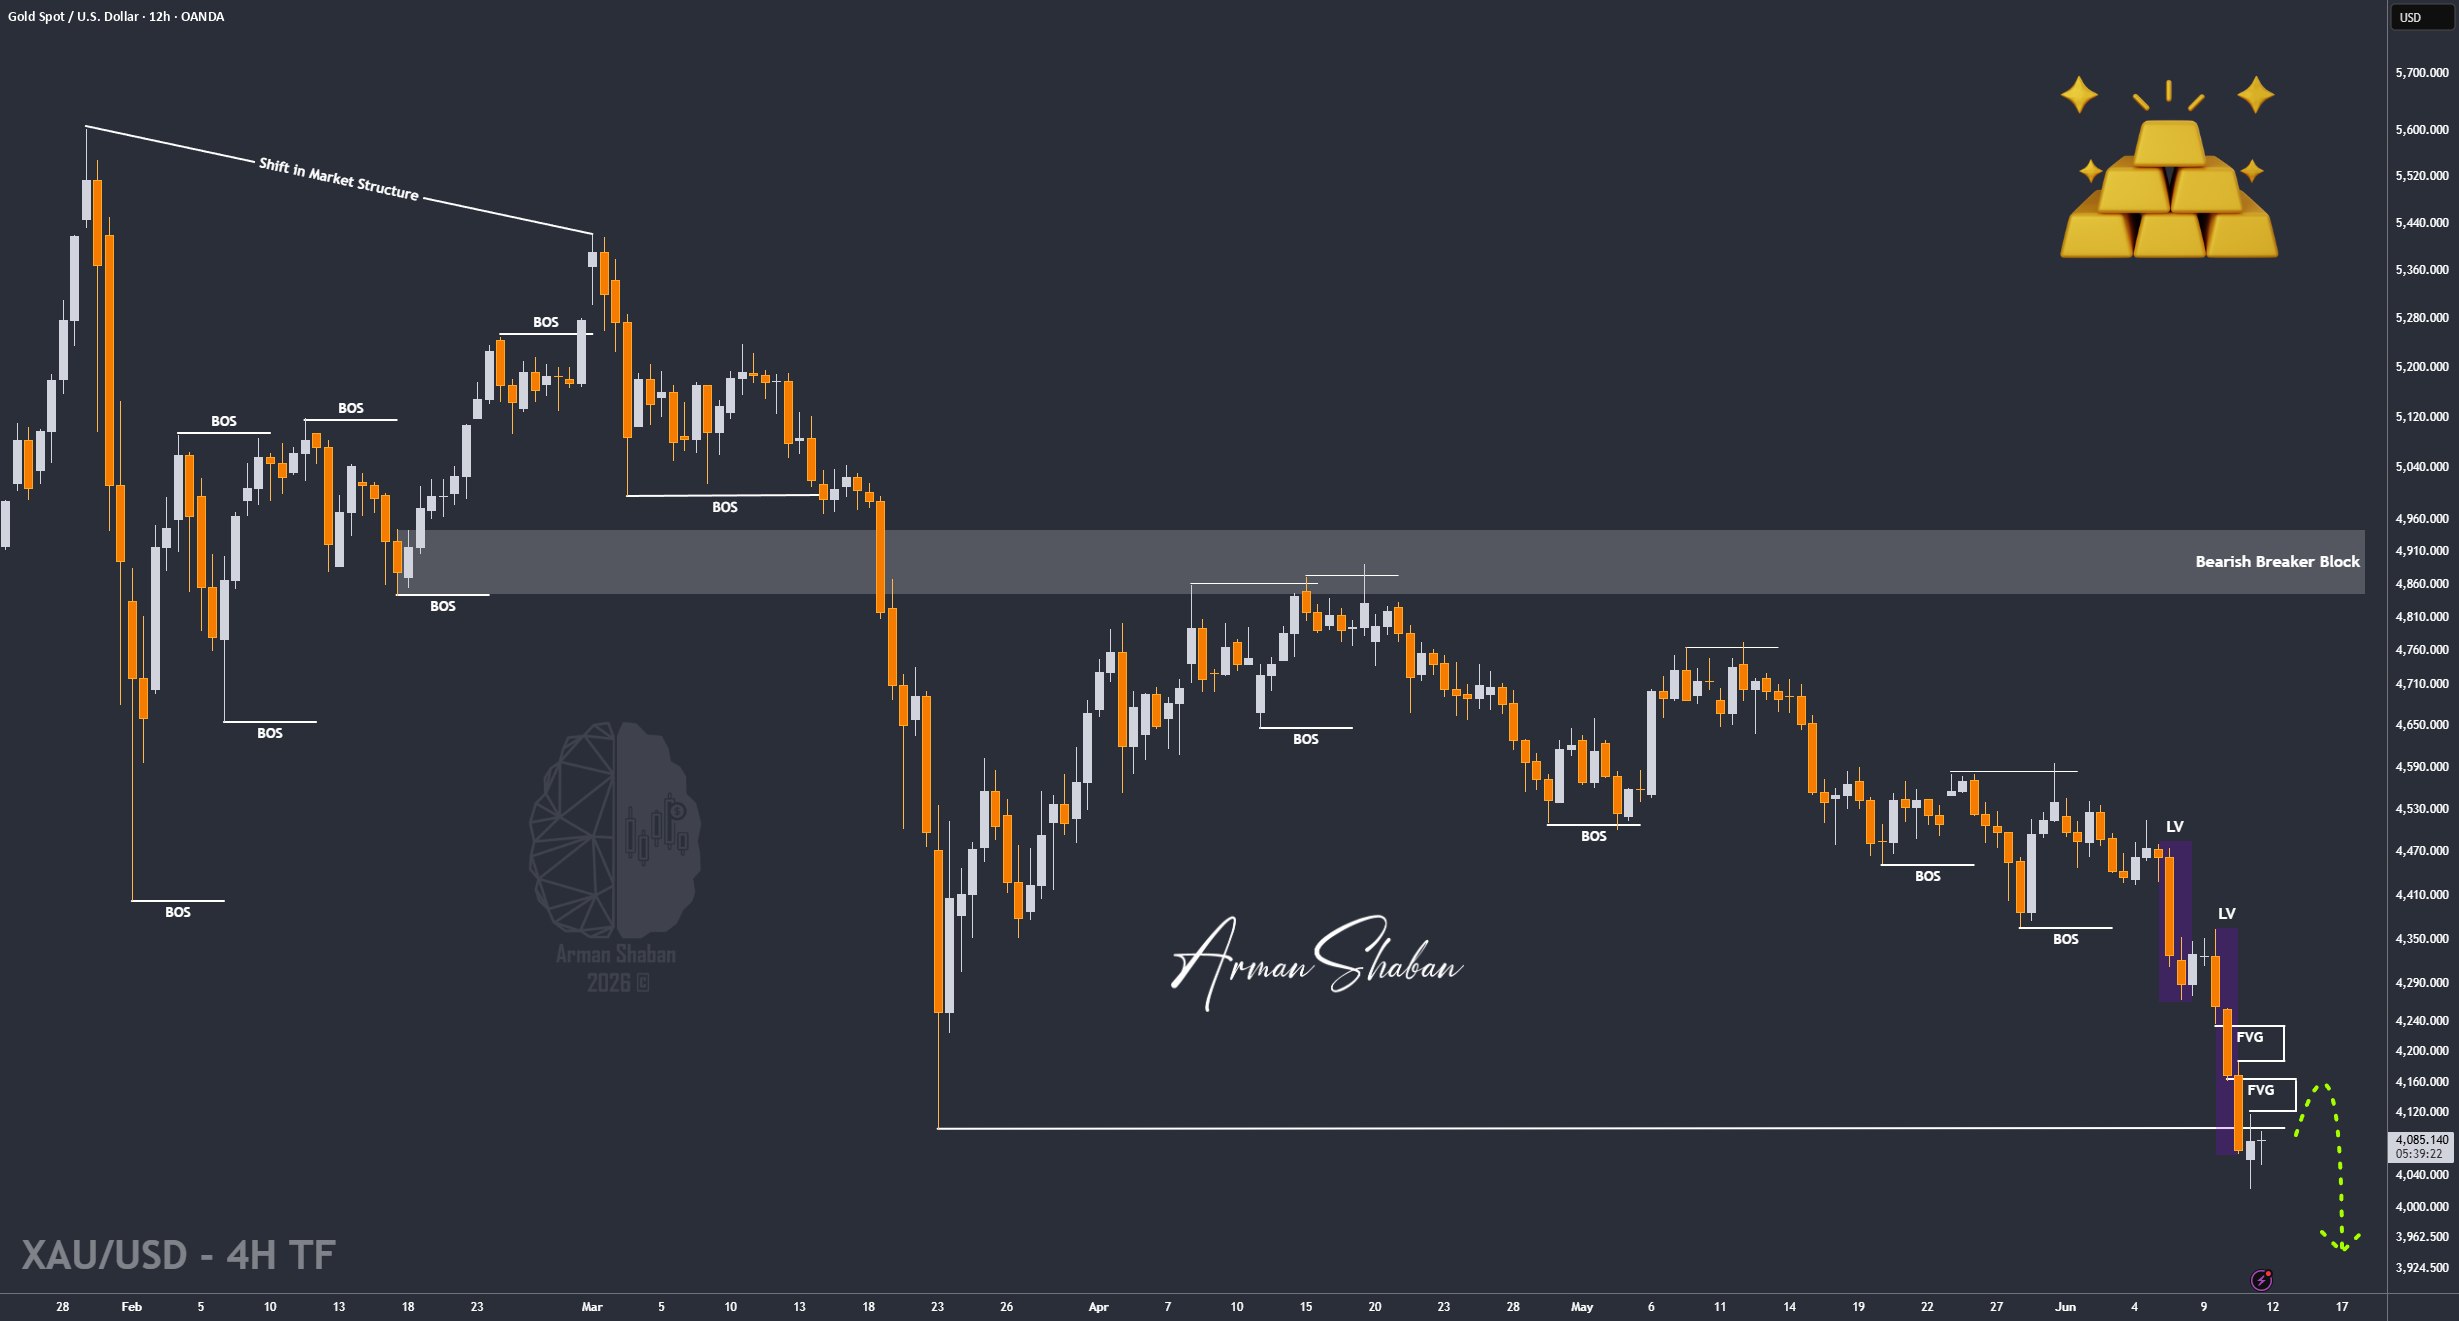
Gold Analysis: By analyzing the #Gold chart on the 4H timeframe, we can see that price once again followed the bearish scenario discussed in our previous update. Gold successfully reached the $4100 downside target and extended its decline even further, printing a fresh low around $4023 before rebounding modestly.
Currently, Gold is trading around the $4081 region. Despite this temporary recovery, the broader structure remains heavily bearish and, in my view, lower liquidity levels are still attracting price.
From a structural perspective, the nearest supply zones are now located around $4100 – $4125, followed by a stronger resistance cluster between $4160 – $4200. On the downside, the closest demand zones are sitting around $4000 – $4020, with deeper structural support located around $3930 – $3960.
In my view, the next bearish targets to monitor are $3999, followed by $3950, and then $3930. However, traders should keep in mind that two unfilled Fair Value Gaps are still present on the chart. The first FVG lies between $4121 – $4165, while the second one is located around $4188 – $4234.
That said, I believe the probability of another bearish leg toward lower liquidity levels is higher before Gold attempts to revisit and fill those imbalances. For now, sellers remain firmly in control and the overall bias continues to favor further downside.
This analysis will be updated as the market evolves.
(This Post on TradingView)
Author : Arman Shaban
To see more analyzes of Gold , Forex Pairs , Cryptocurrencies , Indices and Stocks , be sure to Follow and Join us on other Platforms :
– Public Telegram Channel
– YouTube Channel
– TradingView
– X (Twitter)
– How to join our FOREX VIP Channel ?
– How to join our Crypto VIP Channel ?
– CONTACT ME directly on Telegram