Gold Analysis – 09.Jun.2026
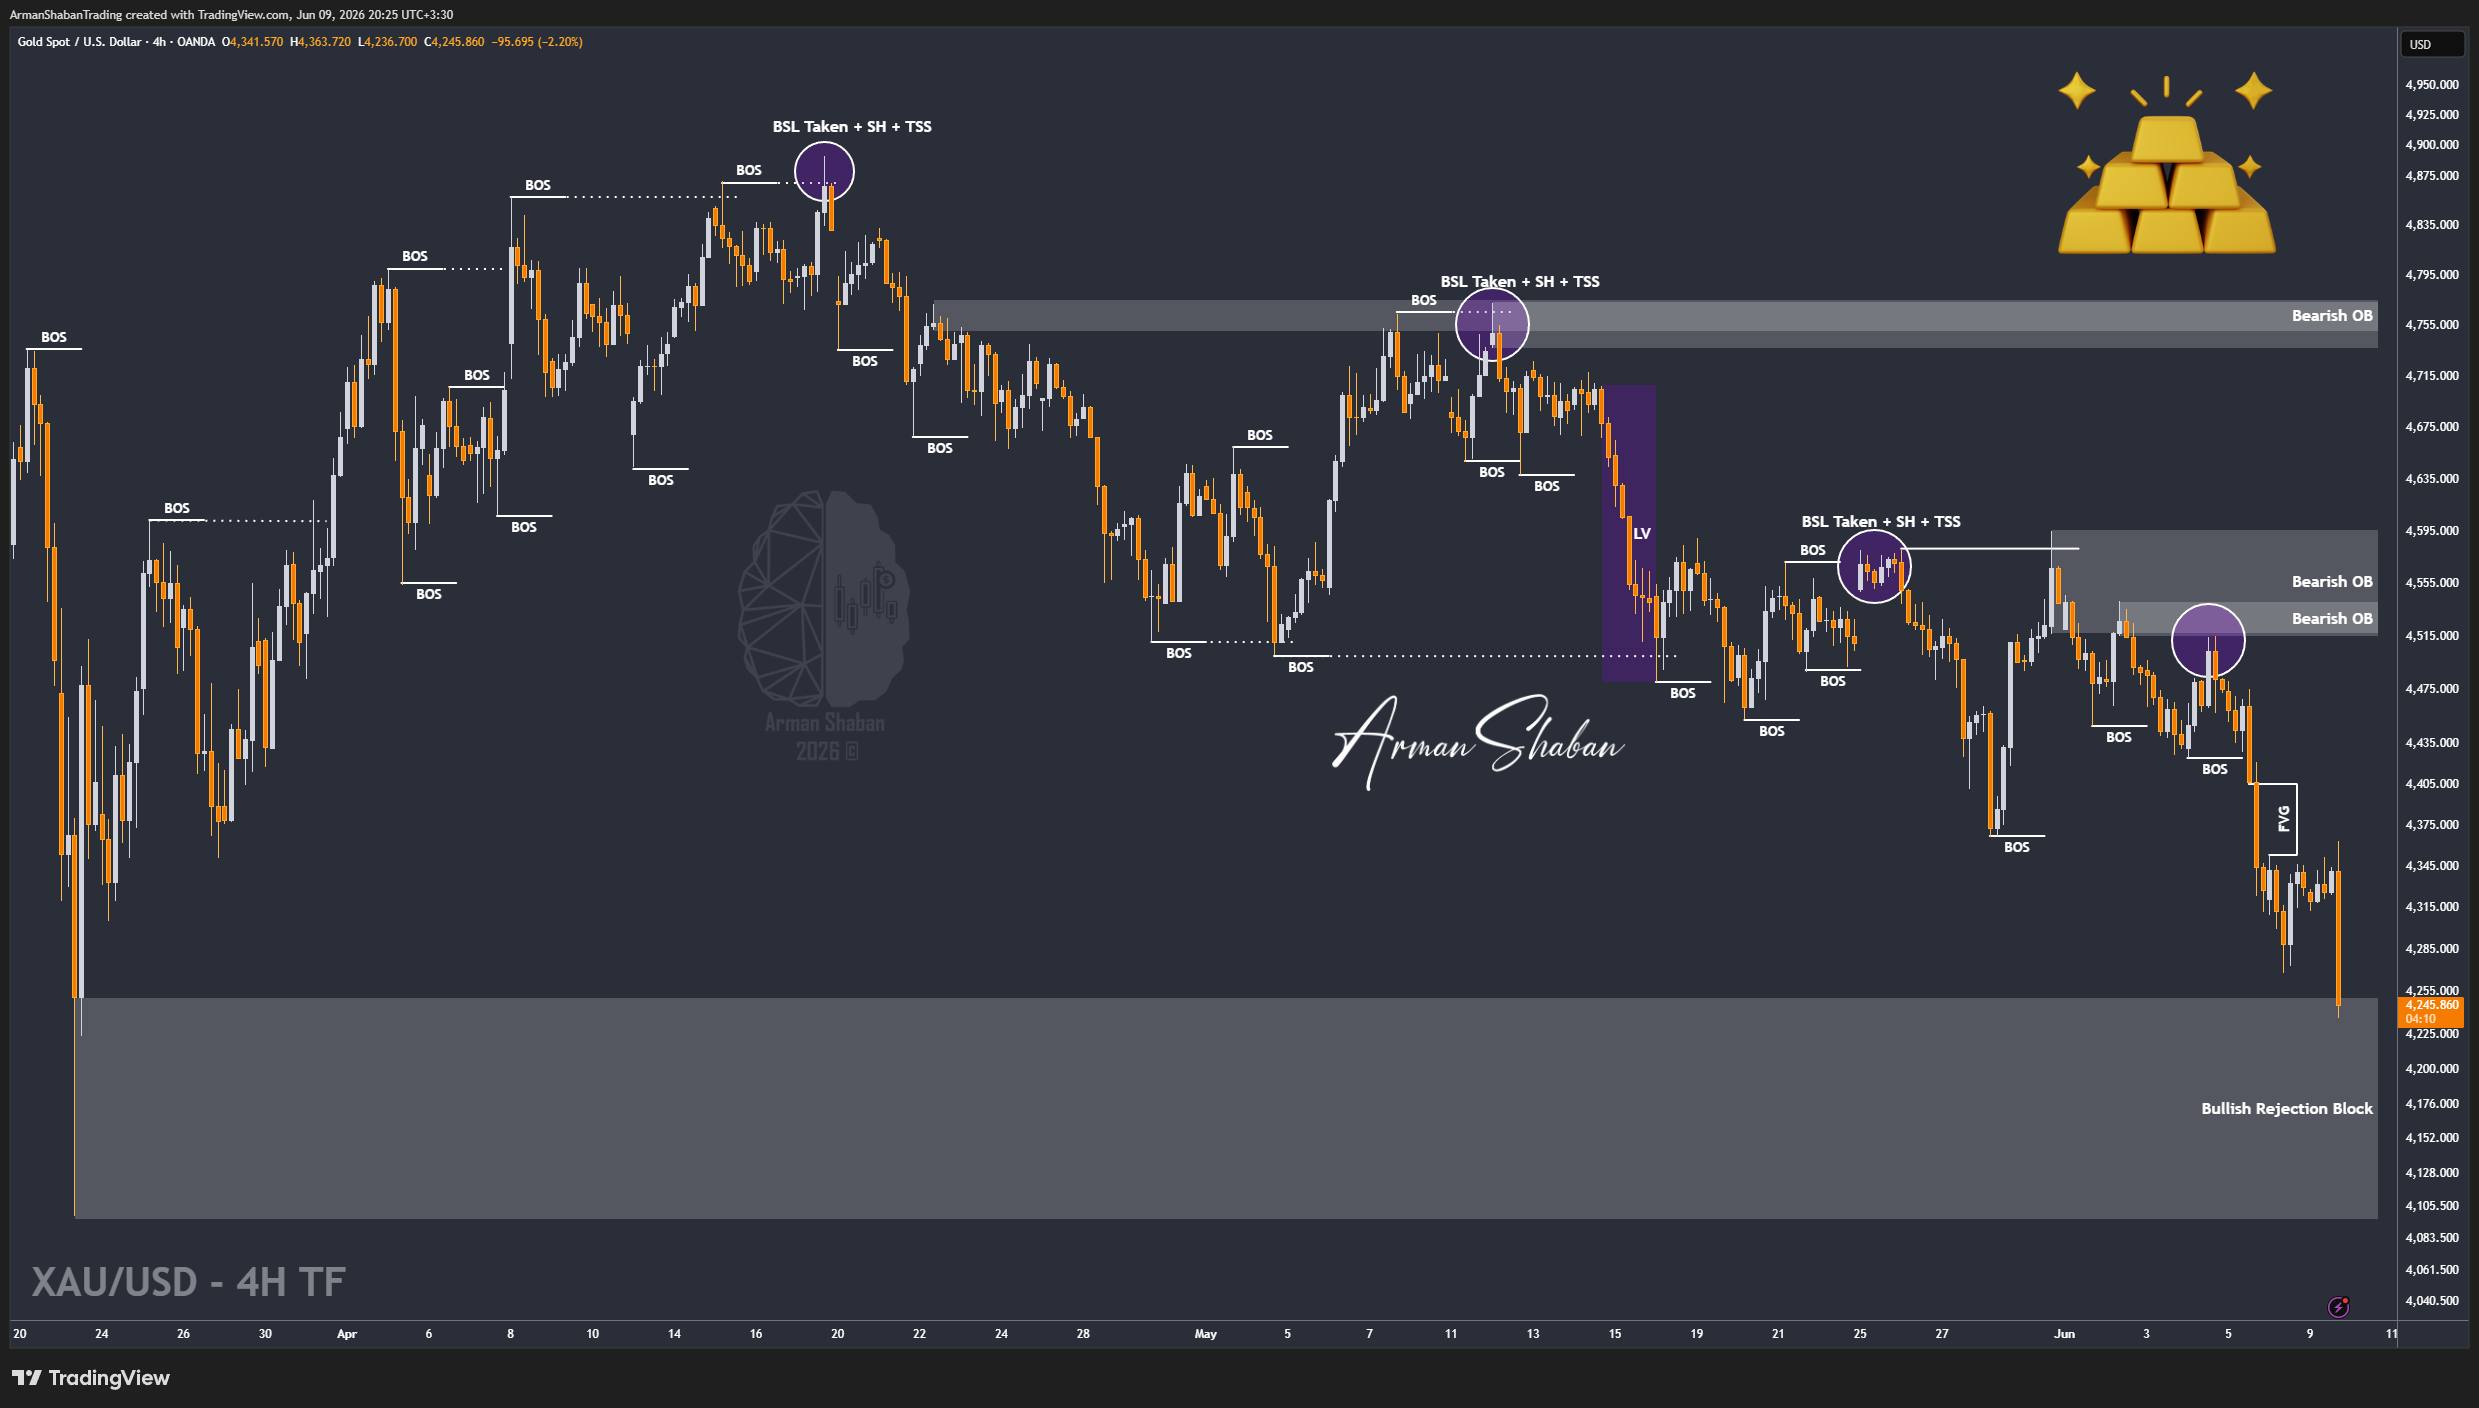
Gold Analysis: By analyzing the #Gold chart on the 4H timeframe, we can see that price once again respected the bearish scenario discussed in our previous update. After recovering toward the $4364 region, sellers aggressively stepped back into the market and triggered another heavy sell-off.
As a result, Gold collapsed sharply and reached a fresh low around $4238 just moments ago, delivering more than 1200 pips of downside movement in less than a day. I hope many of you managed to take advantage of this move.
From a structural perspective, the nearest supply zones are now located around $4280 – $4310, followed by a stronger resistance cluster between $4340 – $4370. On the downside, the closest demand zones are sitting around $4200 – $4220, with deeper structural support located around $4090 – $4120.
In my view, as long as Gold remains below the higher supply zones, the broader bearish structure remains fully intact. The next downside targets to monitor are $4200, followed by $4150, then $4100. If bearish momentum accelerates further, Gold could potentially extend toward the major psychological level around $3999 in the medium term.
For now, Gold remains extremely sensitive to geopolitical developments and headline-driven volatility. Nevertheless, sellers continue to dominate the market structure and lower liquidity levels remain exposed.
This analysis will be updated as the market evolves.
(This Post on TradingView)
Author : Arman Shaban
To see more analyzes of Gold , Forex Pairs , Cryptocurrencies , Indices and Stocks , be sure to Follow and Join us on other Platforms :
– Public Telegram Channel
– YouTube Channel
– TradingView
– X (Twitter)
– How to join our FOREX VIP Channel ?
– How to join our Crypto VIP Channel ?
– CONTACT ME directly on Telegram