Bitcoin Analysis – 10.Oct.2025
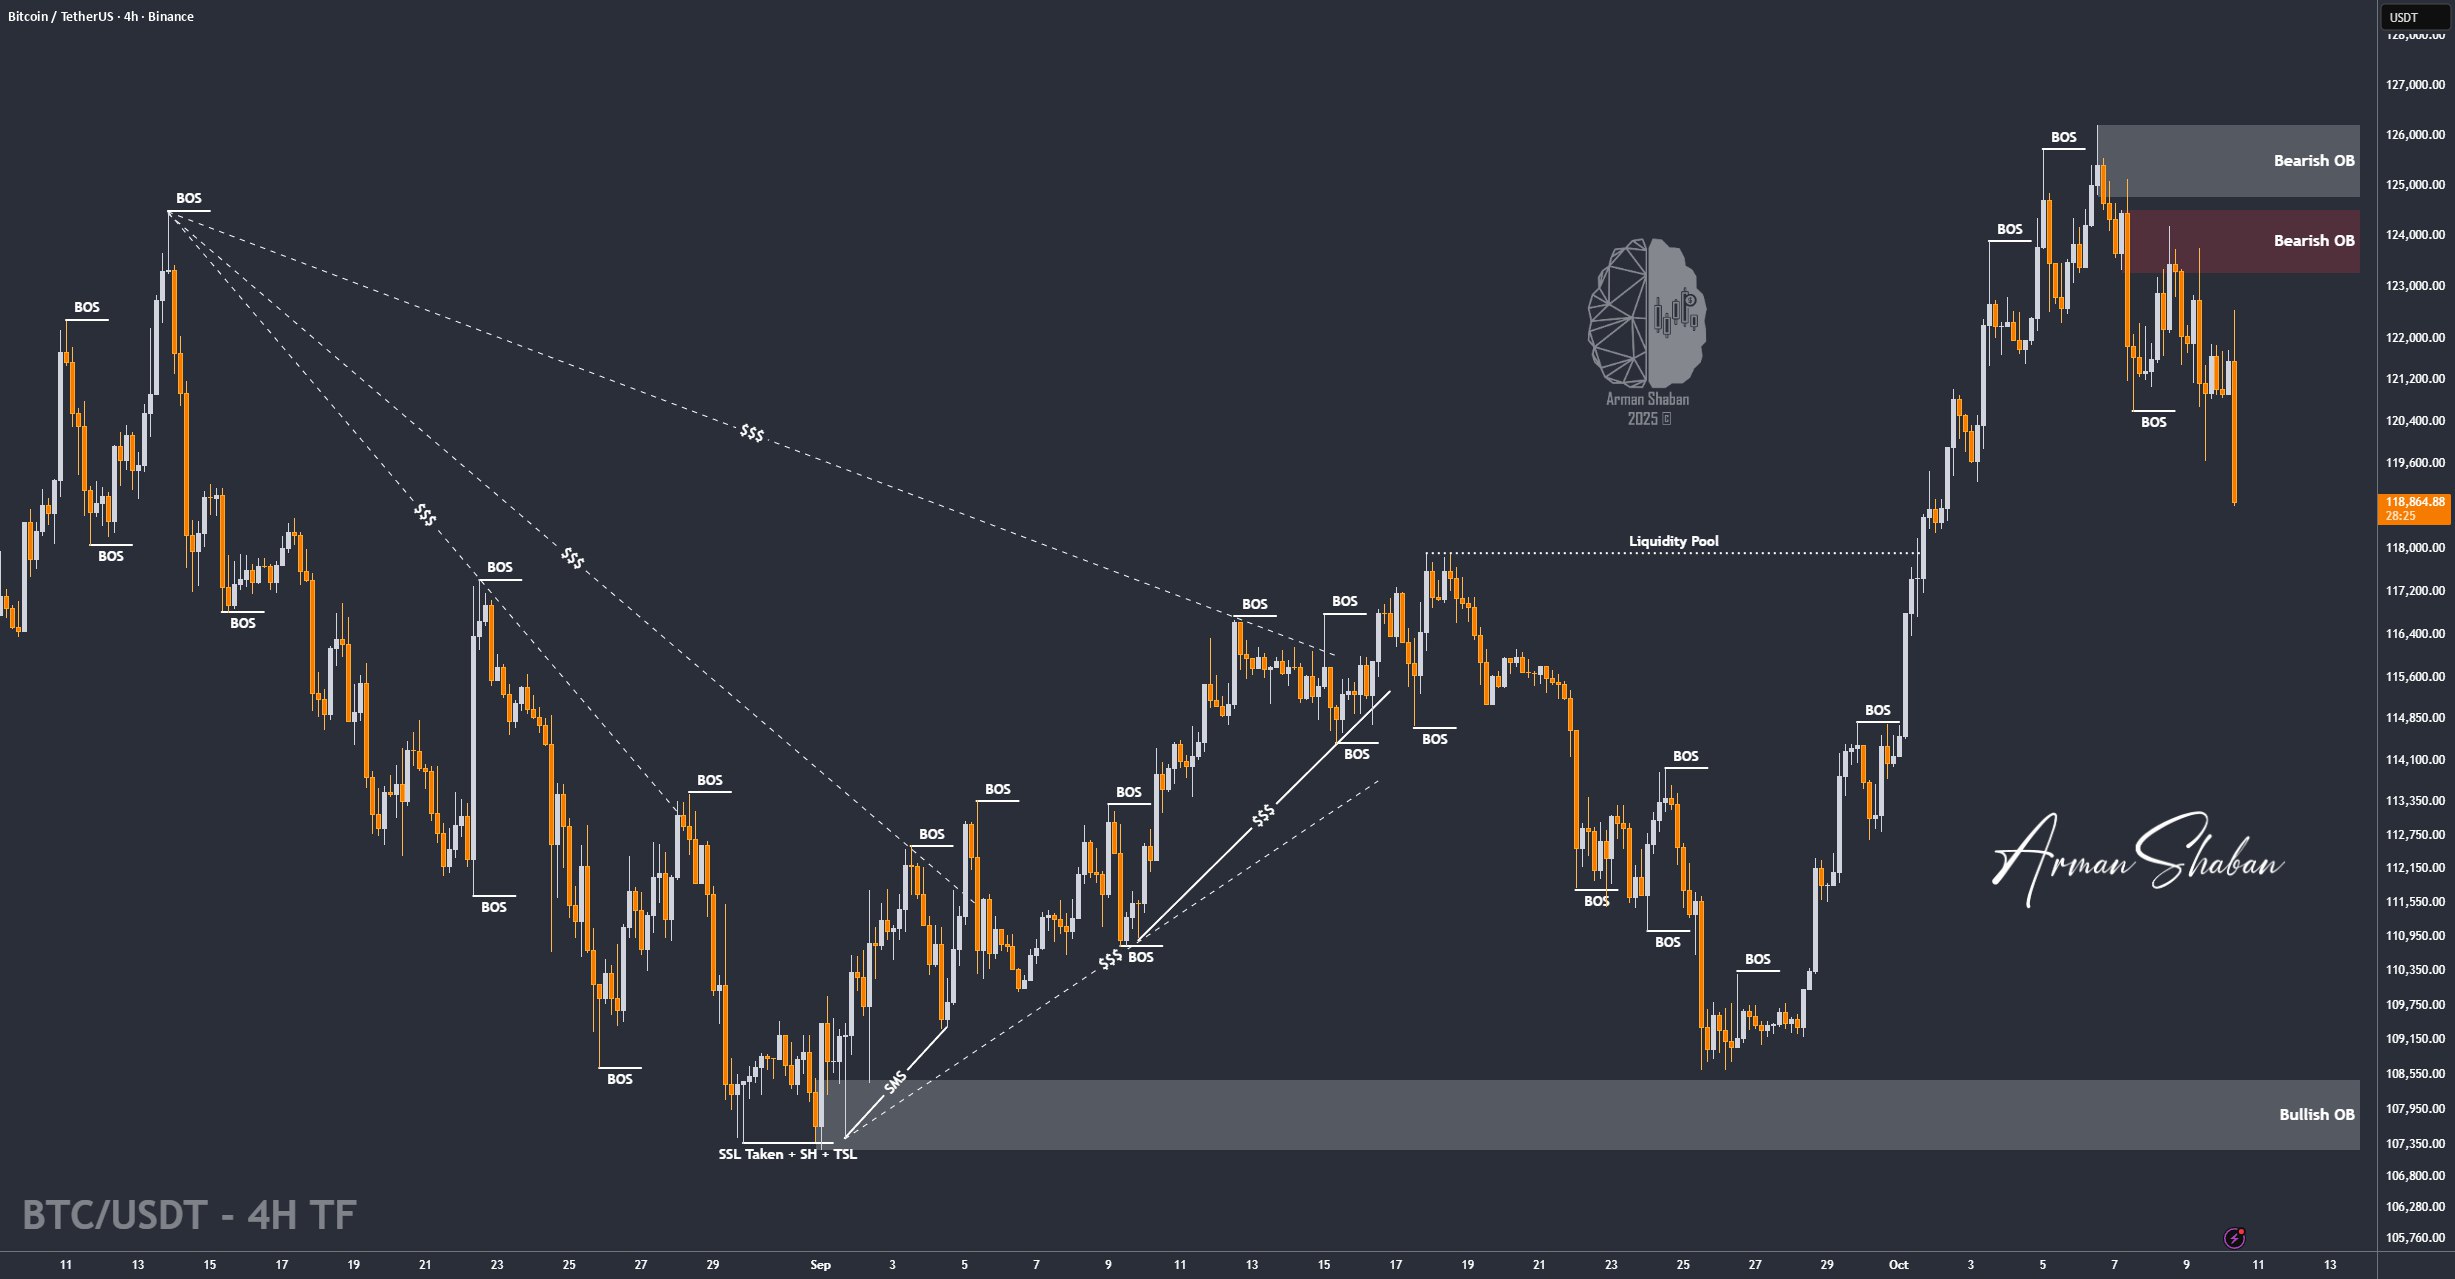
Bitcoin Analysis: By analyzing the Bitcoin (BTC) chart on the 4-hour timeframe, we can see that after rallying up to $126,000 and setting a new all-time high (ATH), the price faced a sharp correction and is now trading around $119,000. This drop could extend further toward $117,000, which is a key level to watch closely. If Bitcoin manages to hold above this zone, we could see the next bullish wave begin. Otherwise, the next major demand zones are at $115,000, $113,500, and $112,120.
(This Post on TradingView)
Author : Arman Shaban
To see more analyzes of Gold , Forex Pairs , Cryptocurrencies , Indices and Stocks , be sure to Follow and Join us on other Platforms :
– Public Telegram Channel
– YouTube Channel
– TradingView
– X (Twitter)
– How to join our FOREX VIP Channel ?
– How to join our Crypto VIP Channel ?
– CONTACT ME directly on Telegram