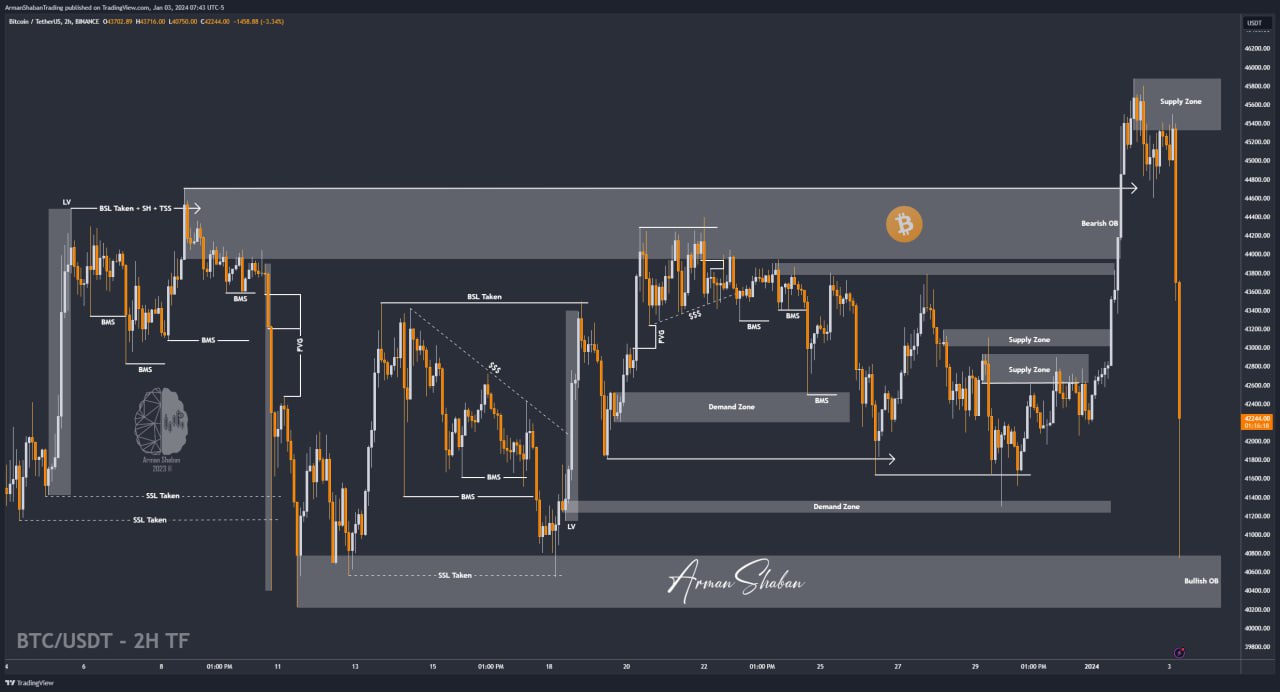
Bitcoin Analysis – 03.Jan.2024

Bitcoin Analysis: By checking the Bitcoin chart in the 2-hour time frame, we can see that the price started to grow from the same range as I expected and was able to grow to about $45,900 and hit the mid-term target! After this attractive growth , today, the price was accompanied by a heavy drop and experienced a drop of more than 10% in the past hours! Pay attention, the price started to fall from $45,900 and reached $40,750! By entering this demand zone, the price experienced a growth of almost %4, and as you can see on the chart, it is currently trading in the range of $42,400! Soon we will witness the filling of the liquidity void caused by this heavy fall! Monitor the range of $45,000 to $45,500 for SELL!
(This Post on TradingView)
Author : Arman Shaban
– Related Ideas :
– BITCOIN : 30.Dec.2023
– BITCOIN : 22.Dec.2023
– BITCOIN : 07.Dec.2023
– CARDANO : 09.Nov.2023
– ETHEREUM : 09.Nov.2023
To see more analyzes of Gold , Forex Pairs , Cryptocurrencies , Indices and Stocks , be sure to Follow and Join us on other Platforms :
– Public Telegram Channel
– YouTube Channel
– TradingView
– X (Twitter)
– How to join our FOREX VIP Channel ?
– How to join our Crypto VIP Channel ?
– CONTACT ME directly on Telegram