Gold Analysis – 05.Aug.2026
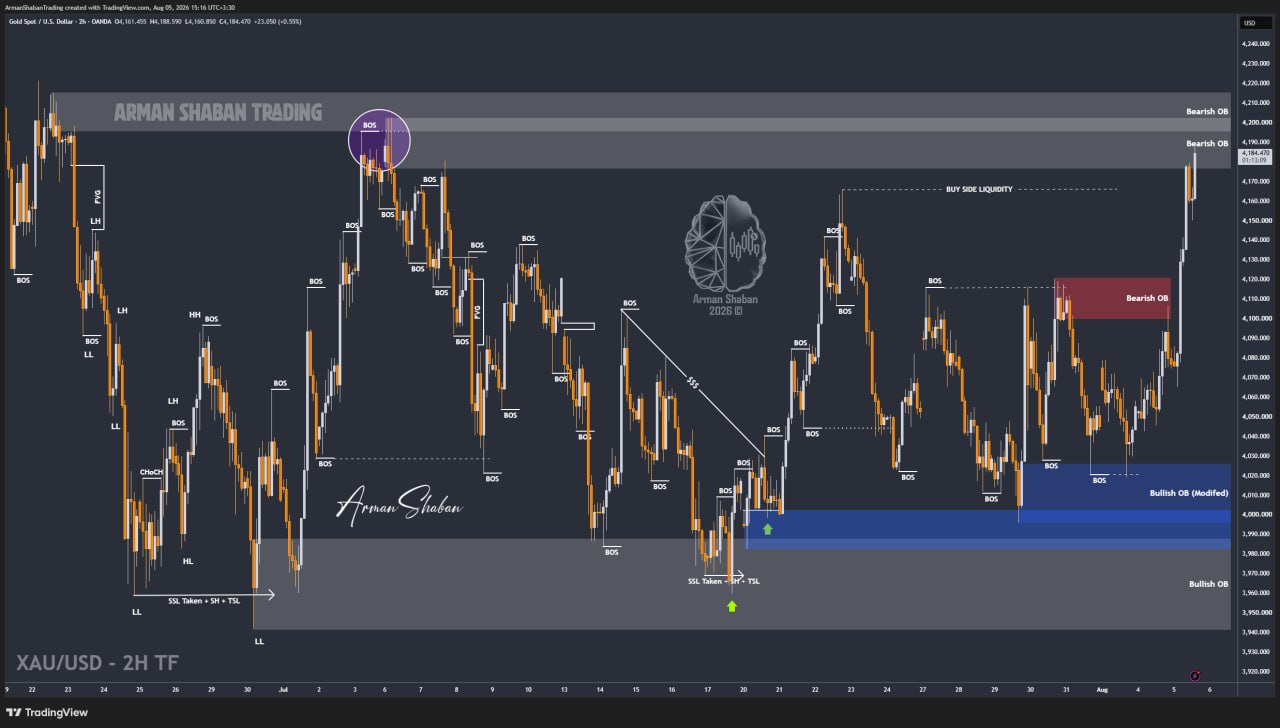
Gold Analysis: By analyzing the #Gold chart on the 2H timeframe, we can see that price delivered a powerful bullish move and successfully reached all the upside targets mentioned in the previous analysis.
Once Gold reached the $4180 region, sellers stepped in and pushed price back toward $4150. However, buyers regained control and price rallied again, reaching as high as $4187.
At this stage, I see two possible scenarios. Gold could begin correcting directly from the current area, or price may first push higher to sweep the liquidity resting between $4215 and $4221 before starting a larger corrective move.
In my view, the second scenario currently looks more likely.
If Gold collects the liquidity above $4215 – $4221 and sellers step in, the next downside targets to monitor would be $4180, followed by $4165, then $4150, $4130, and potentially $4115 if selling pressure becomes stronger.
For now, the reaction around the $4215 – $4221 liquidity zone will be extremely important for the next move.
(This Post on TradingView)
Author : Arman Shaban
To see more analyzes of Gold , Forex Pairs , Cryptocurrencies , Indices and Stocks , be sure to Follow and Join us on other Platforms :
– Public Telegram Channel
– YouTube Channel
– TradingView
– X (Twitter)
– How to join our FOREX VIP Channel ?
– How to join our Crypto VIP Channel ?
– CONTACT ME directly on Telegram

