Gold Analysis – 04.Aug.2026
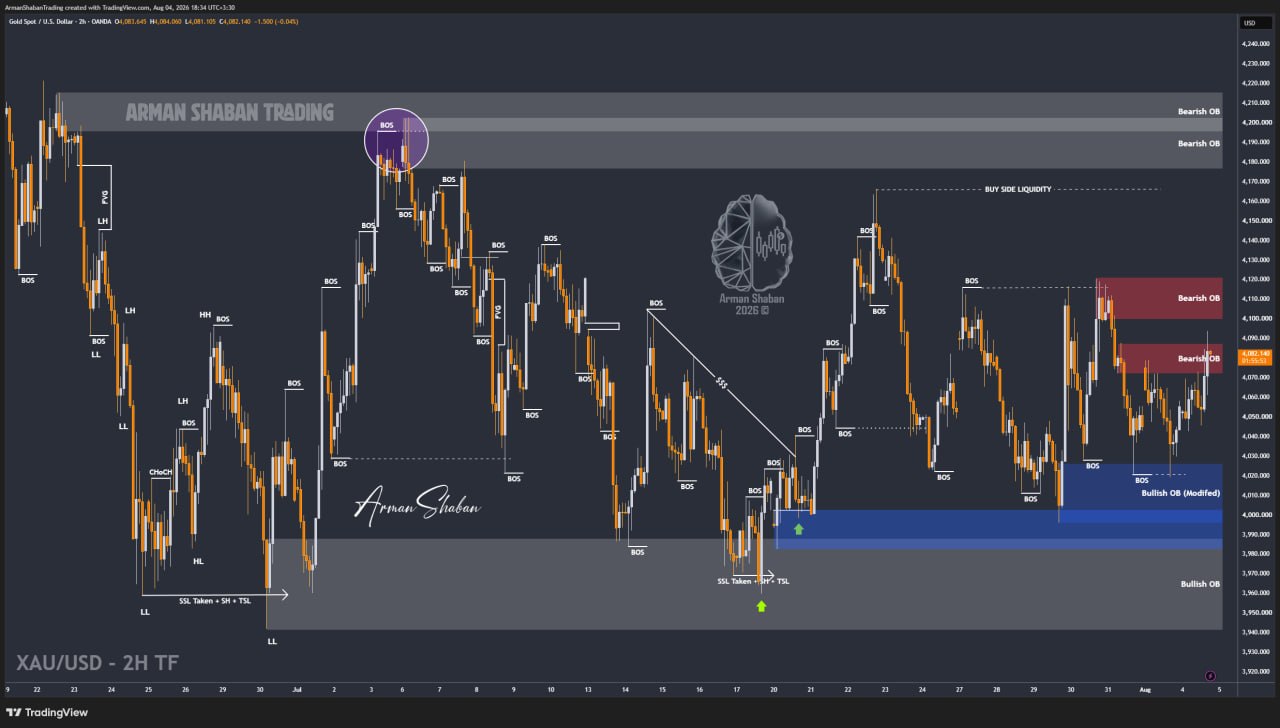
Gold Analysis: By analyzing the #Gold chart on the 2H timeframe, we can see that price followed the expected bullish scenario and continued moving higher, reaching the $4094 region.
After this strong move, Gold entered a minor correction and is currently trading around $4083. In my view, as long as buyers continue defending the nearby demand zones, the probability of another bullish move remains high.
The nearest supply zones to monitor for potential SELL setups are located around $4090 – $4105, followed by $4115 – $4130 and the stronger resistance area between $4145 – $4165.
On the downside, the important demand zones to monitor for potential BUY setups are around $4060 – $4070, followed by $4035 – $4050 and the deeper support area between $4018 – $4030.
If bullish momentum continues, the next upside targets are $4100, followed by $4120, then $4140, $4160, and potentially $4180.
For now, my main short-term bias remains bullish, but price reactions around these supply and demand zones should be closely monitored.
(This Post on TradingView)
Author : Arman Shaban
To see more analyzes of Gold , Forex Pairs , Cryptocurrencies , Indices and Stocks , be sure to Follow and Join us on other Platforms :
– Public Telegram Channel
– YouTube Channel
– TradingView
– X (Twitter)
– How to join our FOREX VIP Channel ?
– How to join our Crypto VIP Channel ?
– CONTACT ME directly on Telegram

