Brent Oil Analysis – 23.Jul.2026
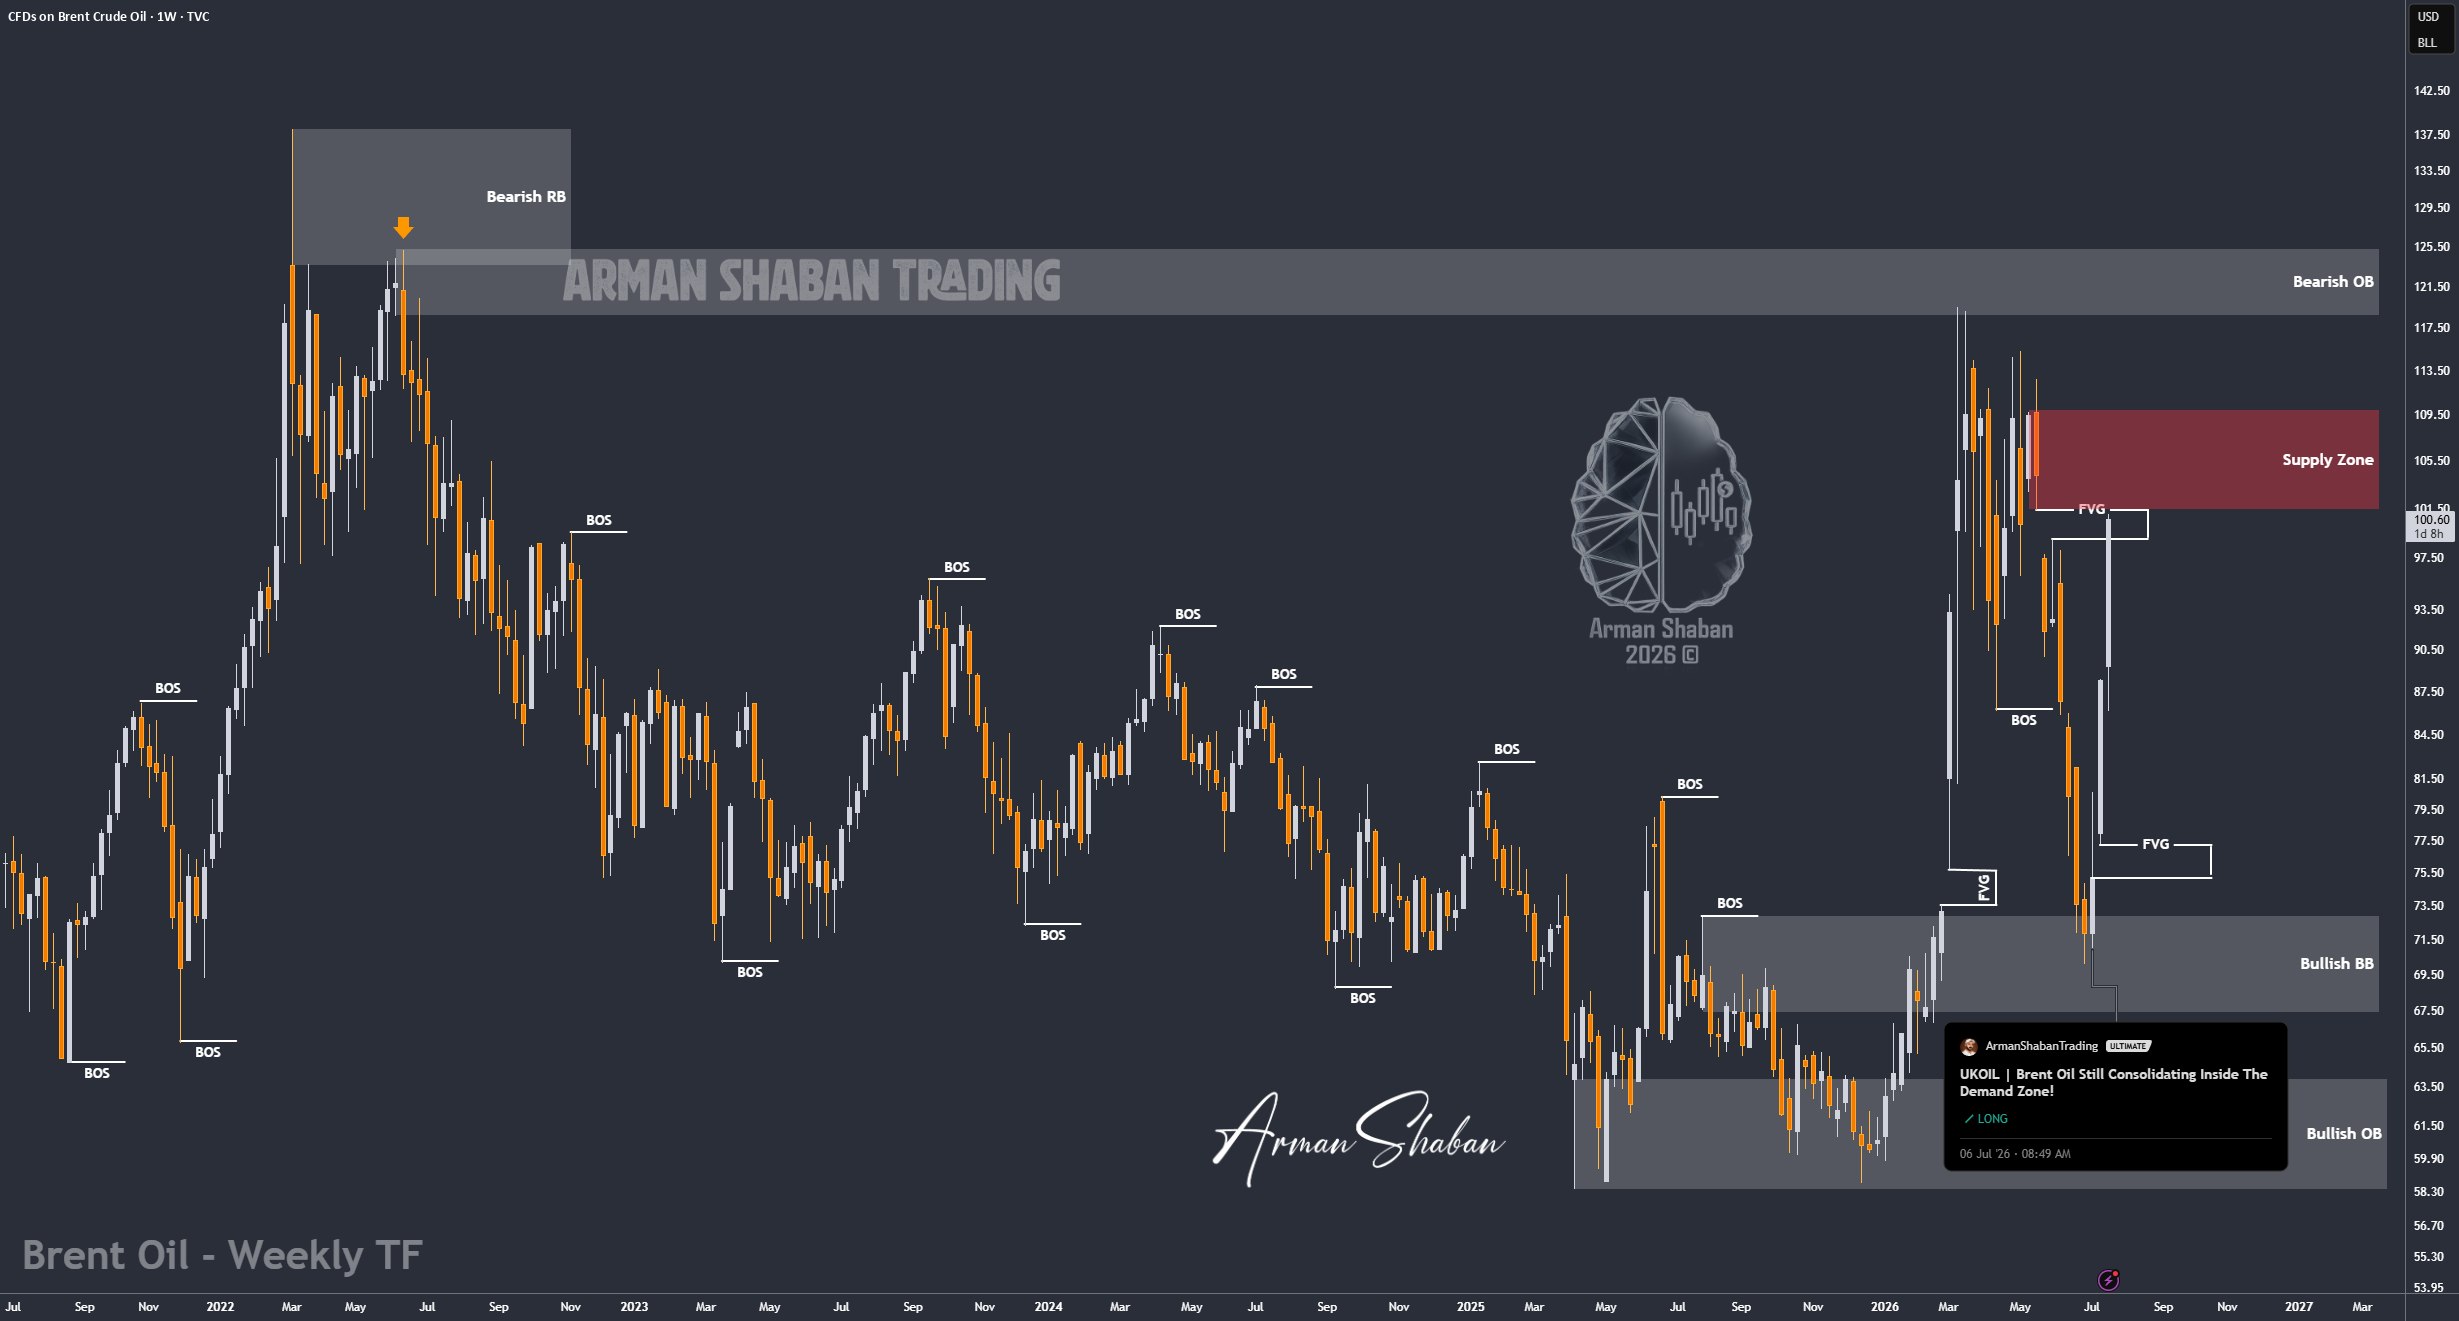
Brent Oil Analysis: By analyzing the #BrentOil chart on the weekly timeframe, we can see that price continued to follow our bullish scenario and finally reached the major psychological $100 level.
The original analysis was published on July 6, when Brent Oil was trading around the key $70 demand zone. At that time, I mentioned that Oil was probably waiting for the right catalyst to begin its next bullish move. That catalyst eventually arrived through renewed geopolitical tensions and conflict involving Iran and the broader region.
As a result, Brent Oil rallied more than 40% in less than three weeks and finally pushed above $100.
With today’s move, price also completely filled the older FVG between $99 and $101. Once again, the market repeated the same behavior we have seen many times before. Price often returns to these imbalances, but sometimes it simply needs the right fundamental catalyst to make the move happen.
The next major supply zone is located between $101.5 and $110. This is a very important area, and the reaction from buyers and sellers inside this zone could determine the next major move.
At the same time, the aggressive rally created a new FVG between $75 and $77.5. In my view, this imbalance will eventually become important again and could be revisited during a deeper corrective phase.
For now, all eyes should remain on the $101.5 to $110 supply zone. The reaction from this area will tell us whether Oil still has enough strength to continue higher or if a larger correction is about to begin.
(This Post on TradingView)
Author : Arman Shaban
To see more analyzes of Gold , Forex Pairs , Cryptocurrencies , Indices and Stocks , be sure to Follow and Join us on other Platforms :
– Public Telegram Channel
– YouTube Channel
– TradingView
– X (Twitter)
– How to join our FOREX VIP Channel ?
– How to join our Crypto VIP Channel ?
– CONTACT ME directly on Telegram

