Gold Analysis – 10.Jun.2026
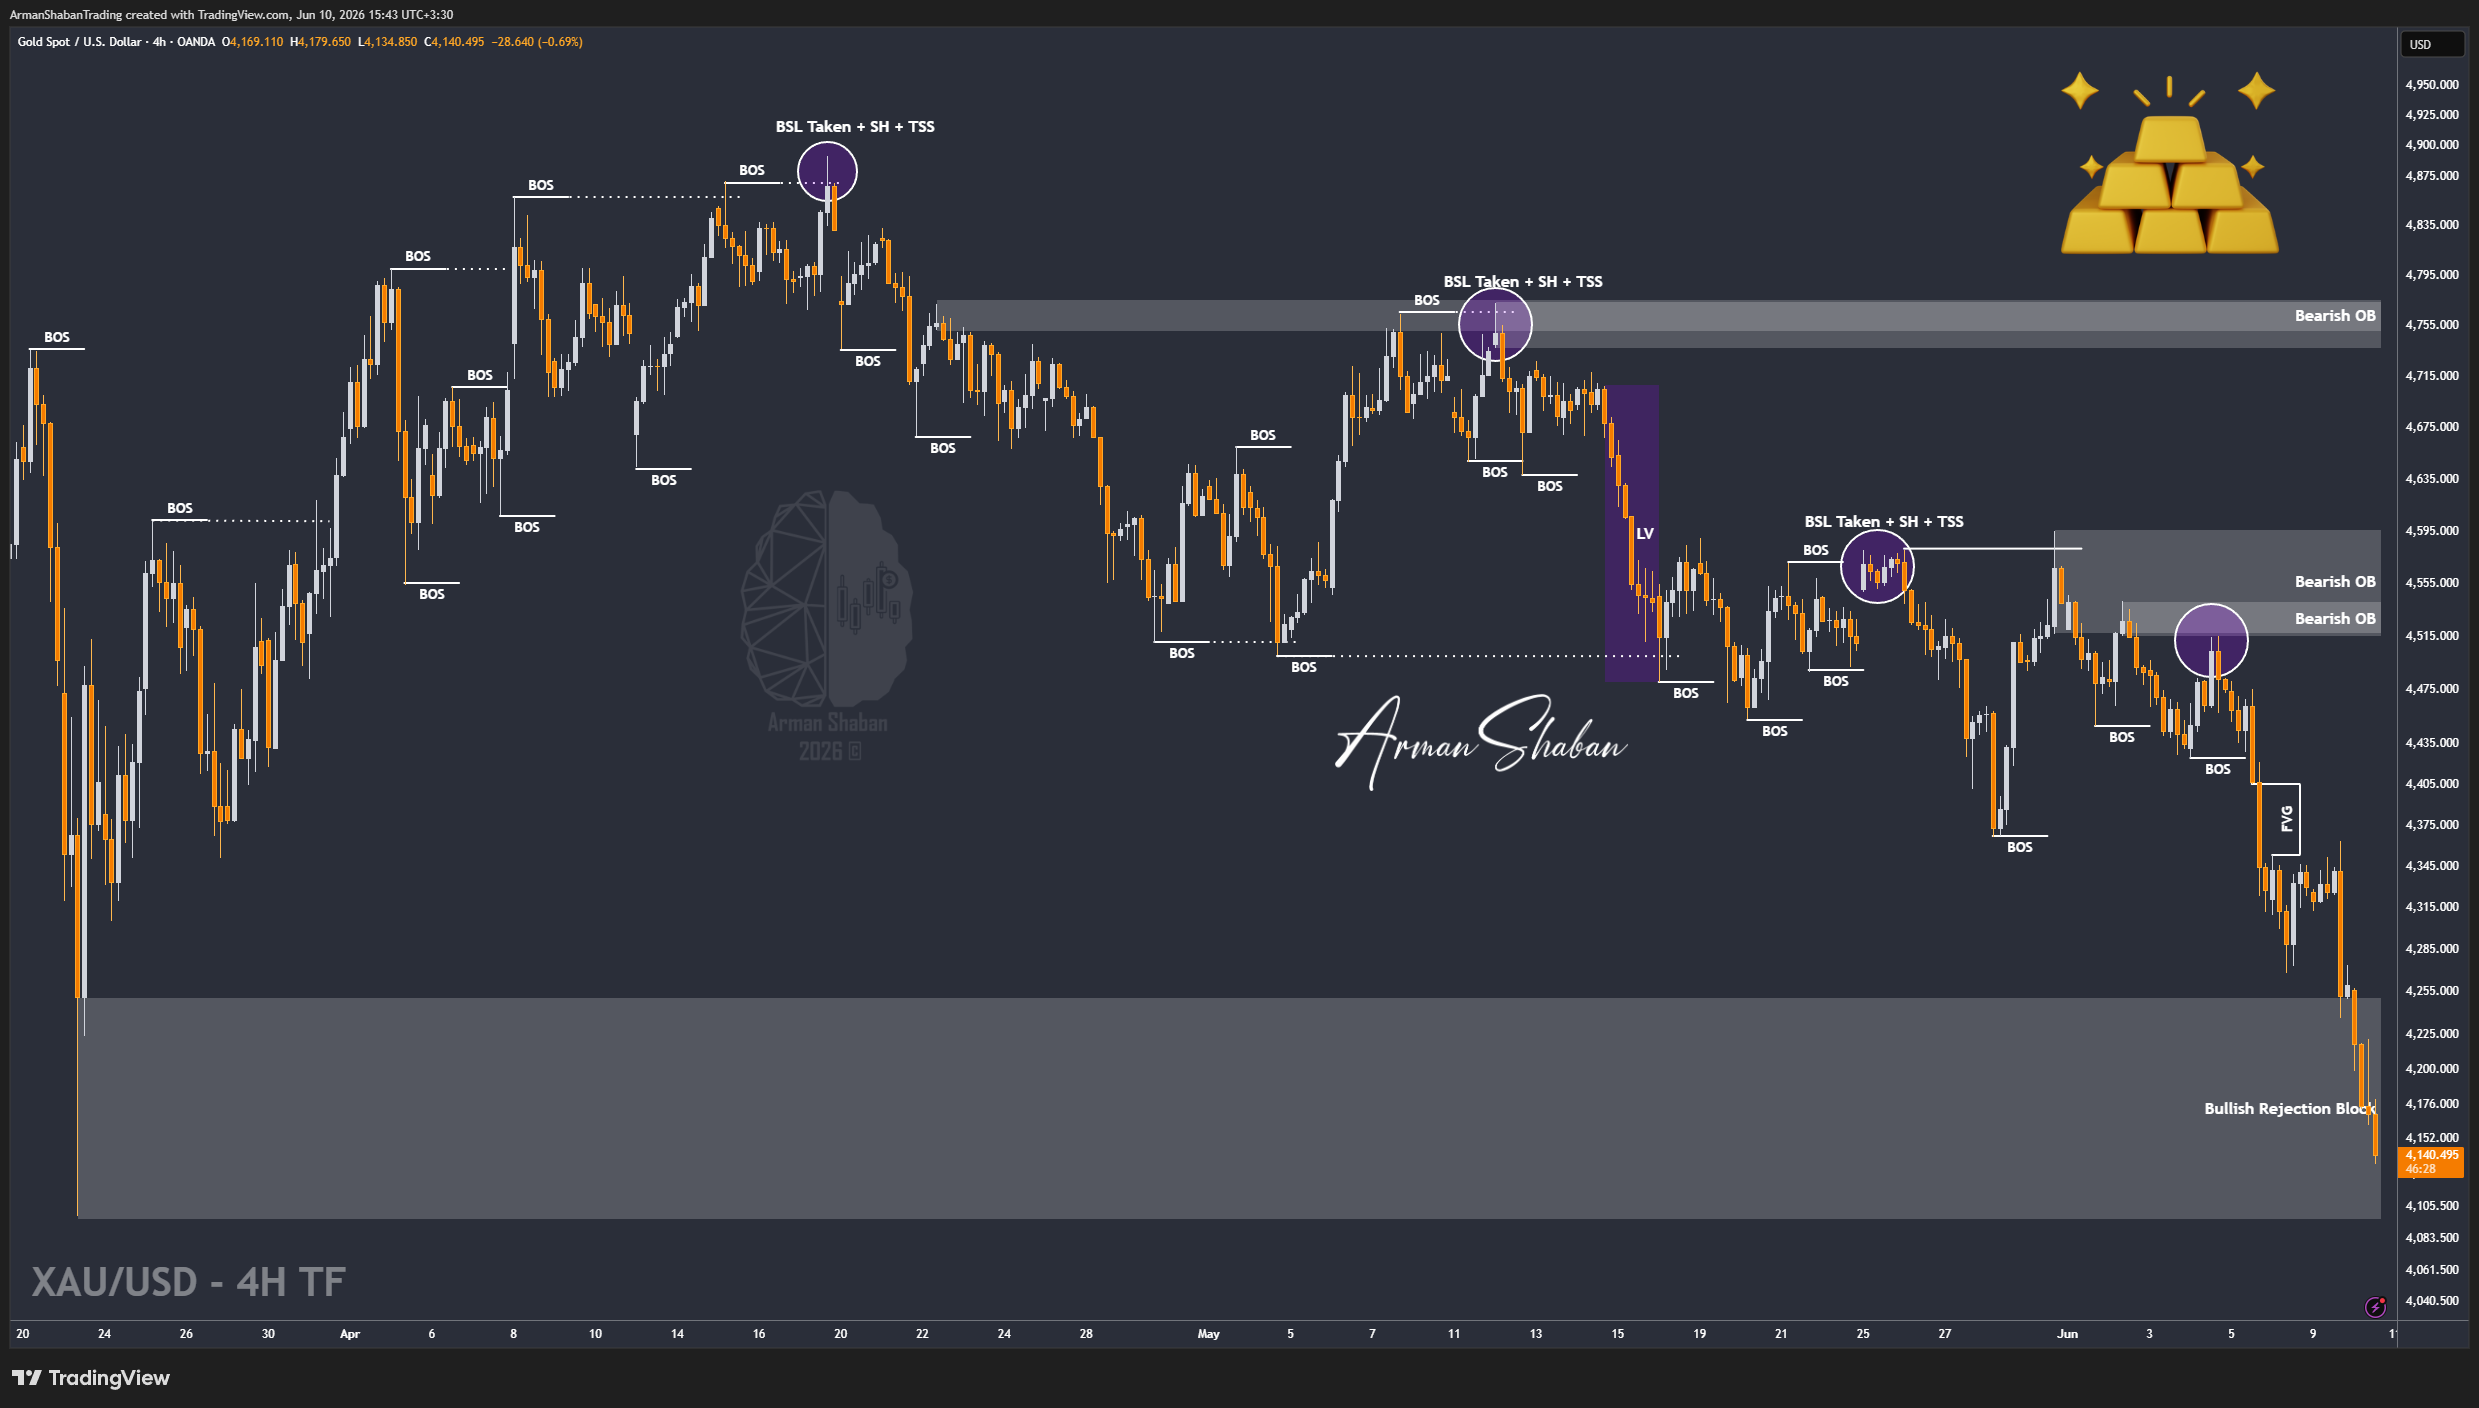
Gold Analysis: By analyzing the #Gold chart on the 4H timeframe, we can see that price once again followed the bearish scenario discussed in our previous update. Gold successfully reached both the $4200 and $4150 downside targets that we highlighted yesterday, bringing the total return from this week’s setups to more than 2200 pips.
Currently, with less than 20 minutes remaining before the CPI release, markets are entering an extremely sensitive phase. In my view, Gold’s aggressive sell-off over the past few sessions suggests that traders may already be pricing in the possibility of a hotter-than-expected U.S. inflation report.
At the same time, geopolitical risks remain elevated. New statements from Trump, including threats regarding Iran and potential attacks on strategic infrastructure, have added another layer of uncertainty and volatility to the market.
From a structural perspective, the nearest supply zones are now located around $4150 – $4180, followed by a stronger resistance cluster between $4220 – $4250. On the downside, the closest demand zones are located around $4080 – $4100, with deeper structural support sitting near $3990 – $4020.
In my view, if today’s CPI data comes in stronger than expected and geopolitical tensions continue to rise, there is a strong possibility that Gold extends its decline below the $4100 level during today’s session. However, traders should be prepared for extreme volatility and sharp reversals around the data release.
For now, the broader bias remains bearish and lower liquidity levels continue to attract price.
This analysis will be updated as the market evolves.
(This Post on TradingView)
Author : Arman Shaban
To see more analyzes of Gold , Forex Pairs , Cryptocurrencies , Indices and Stocks , be sure to Follow and Join us on other Platforms :
– Public Telegram Channel
– YouTube Channel
– TradingView
– X (Twitter)
– How to join our FOREX VIP Channel ?
– How to join our Crypto VIP Channel ?
– CONTACT ME directly on Telegram