Gold Analysis – 22.Apr.2026
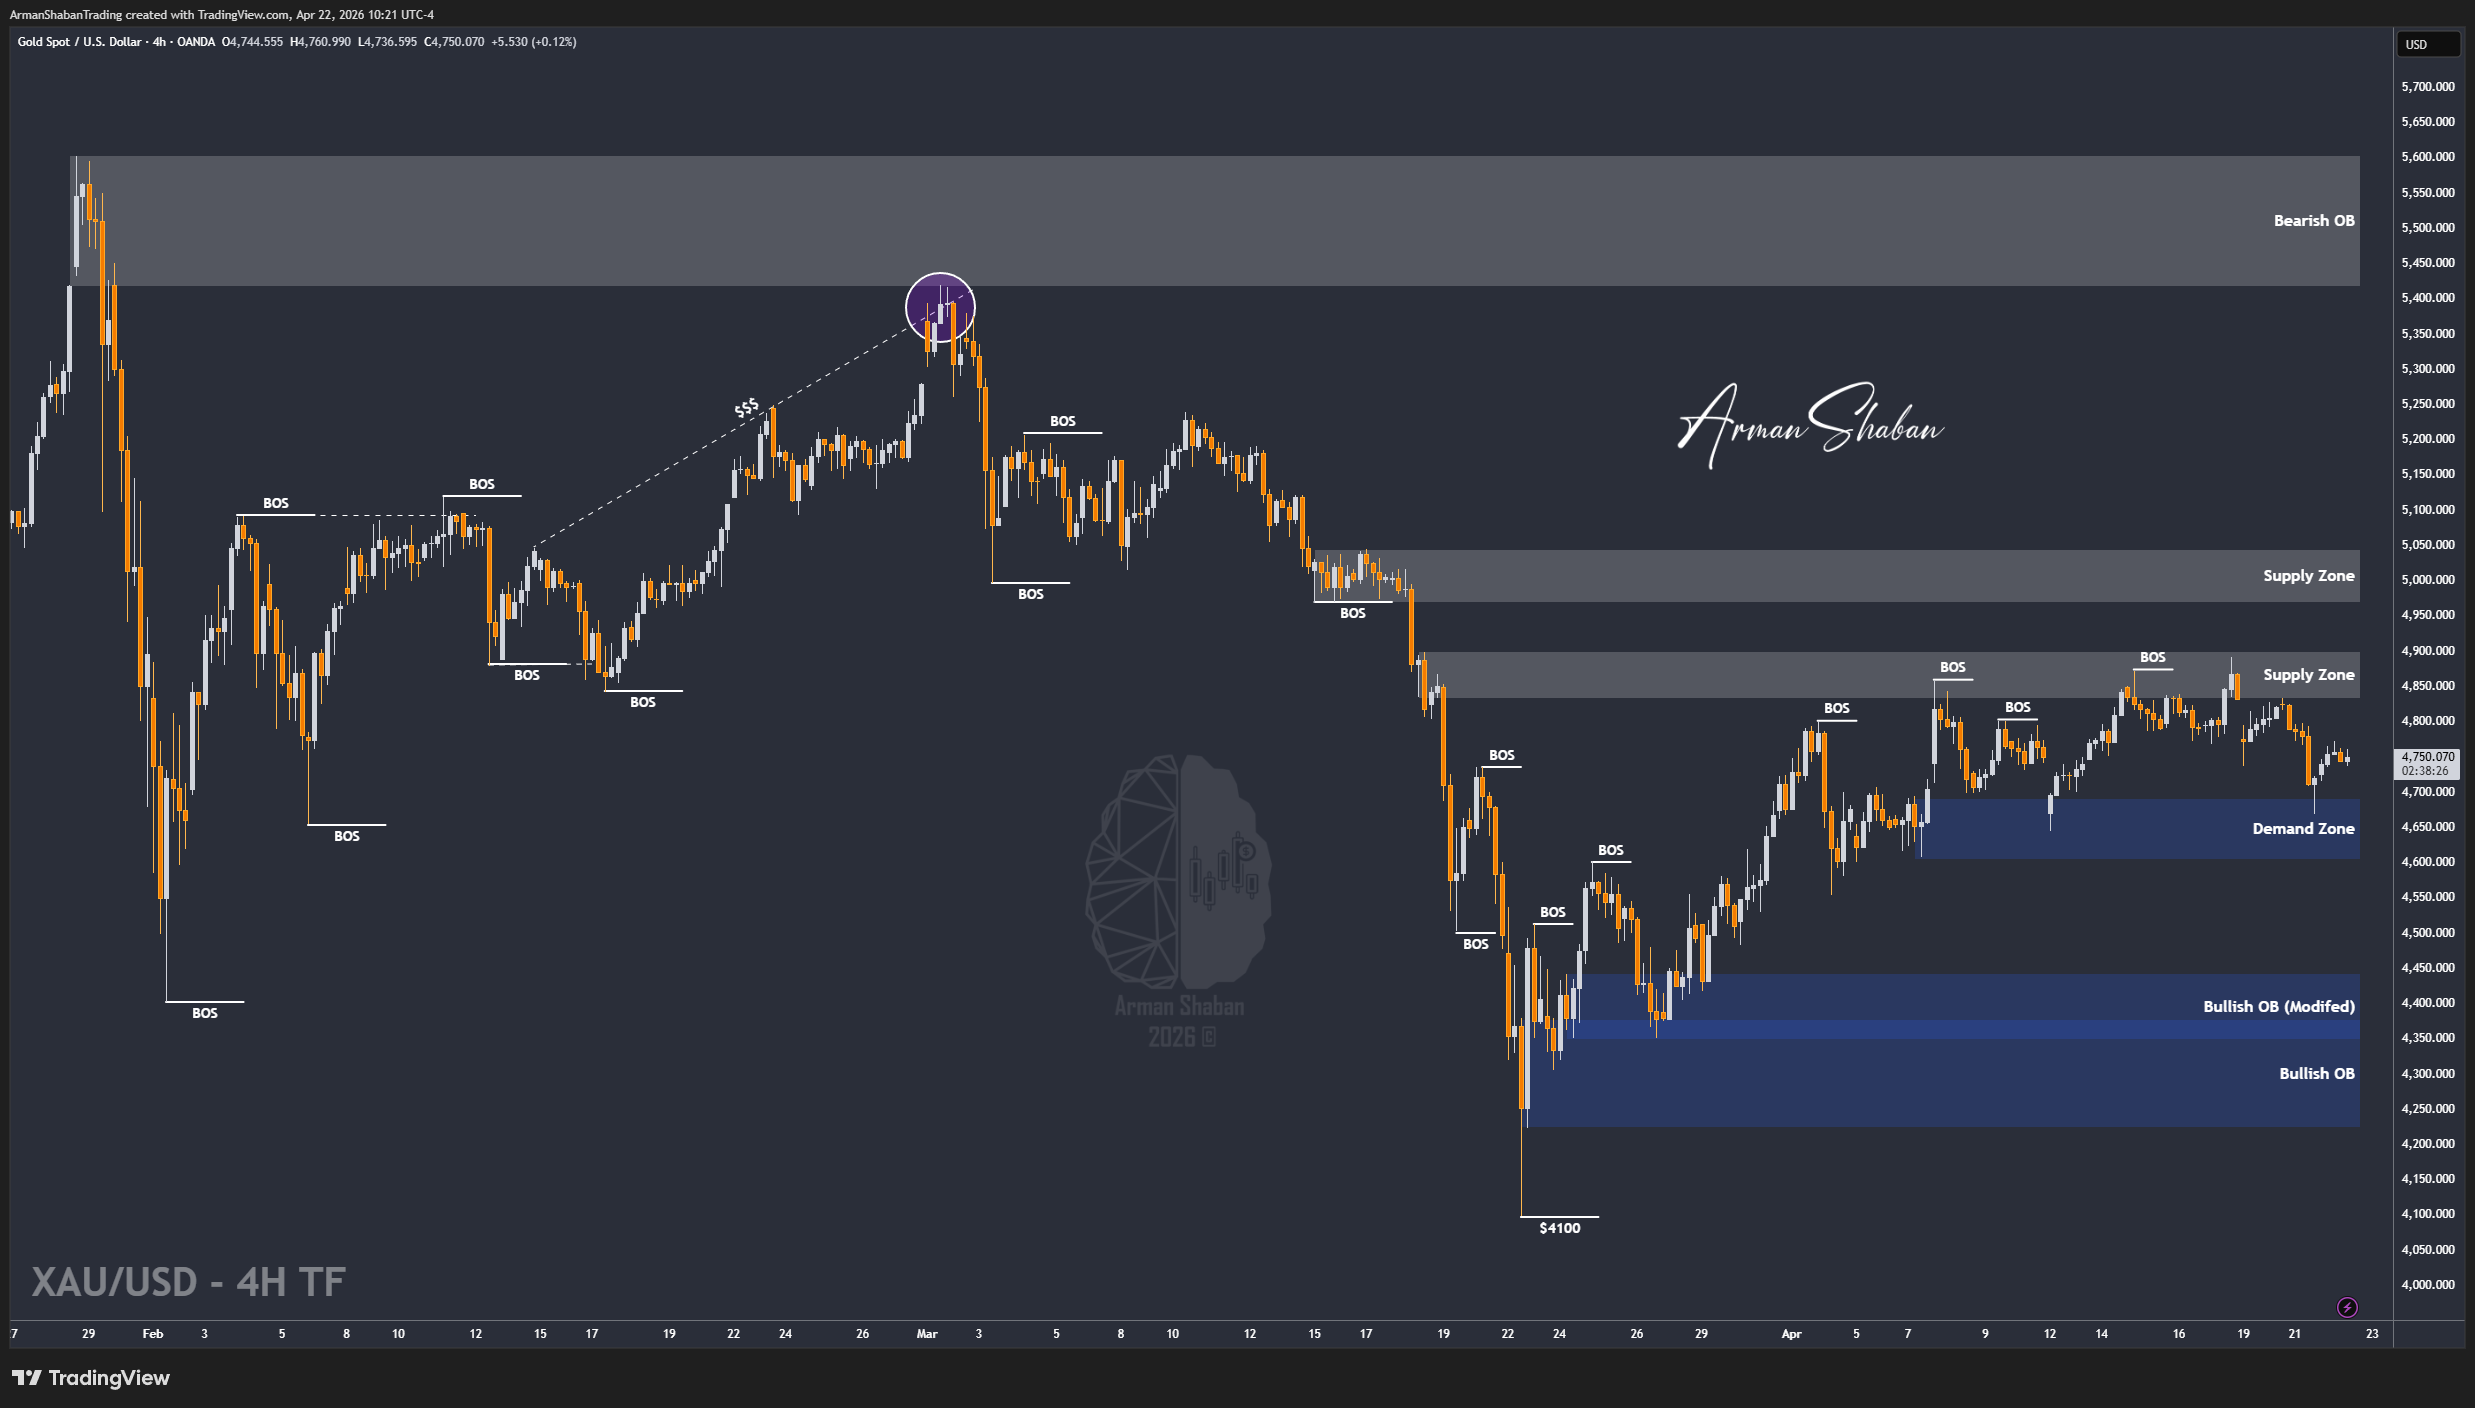
Gold Analysis: By analyzing the #Gold chart on the 4H timeframe, we can see that price followed the bearish scenario exactly as expected. After rejecting from the $4792 region, Gold dropped aggressively toward $4669, delivering more than 1200 pips of return and hitting all projected downside targets.
After reaching the key demand zone, strong buying pressure stepped in and pushed price back up toward $4772. Currently, Gold is trading around the $4747 region, showing early signs of recovery after the sharp sell-off.
From a structural perspective, the nearest demand zones are $4720 – $4740, with deeper support around $4660 – $4690. On the upside, the closest supply zones are $4770 – $4800, followed by a stronger resistance cluster between $4830 – $4870.
If buyers maintain control from this demand area, the next short-term upside targets are $4785, followed by $4810, then $4840, and potentially $4870 if bullish momentum continues to build.
(This Post on TradingView)
Author : Arman Shaban
To see more analyzes of Gold , Forex Pairs , Cryptocurrencies , Indices and Stocks , be sure to Follow and Join us on other Platforms :
– Public Telegram Channel
– YouTube Channel
– TradingView
– X (Twitter)
– How to join our FOREX VIP Channel ?
– How to join our Crypto VIP Channel ?
– CONTACT ME directly on Telegram