Gold Analysis – 17.Feb.2026
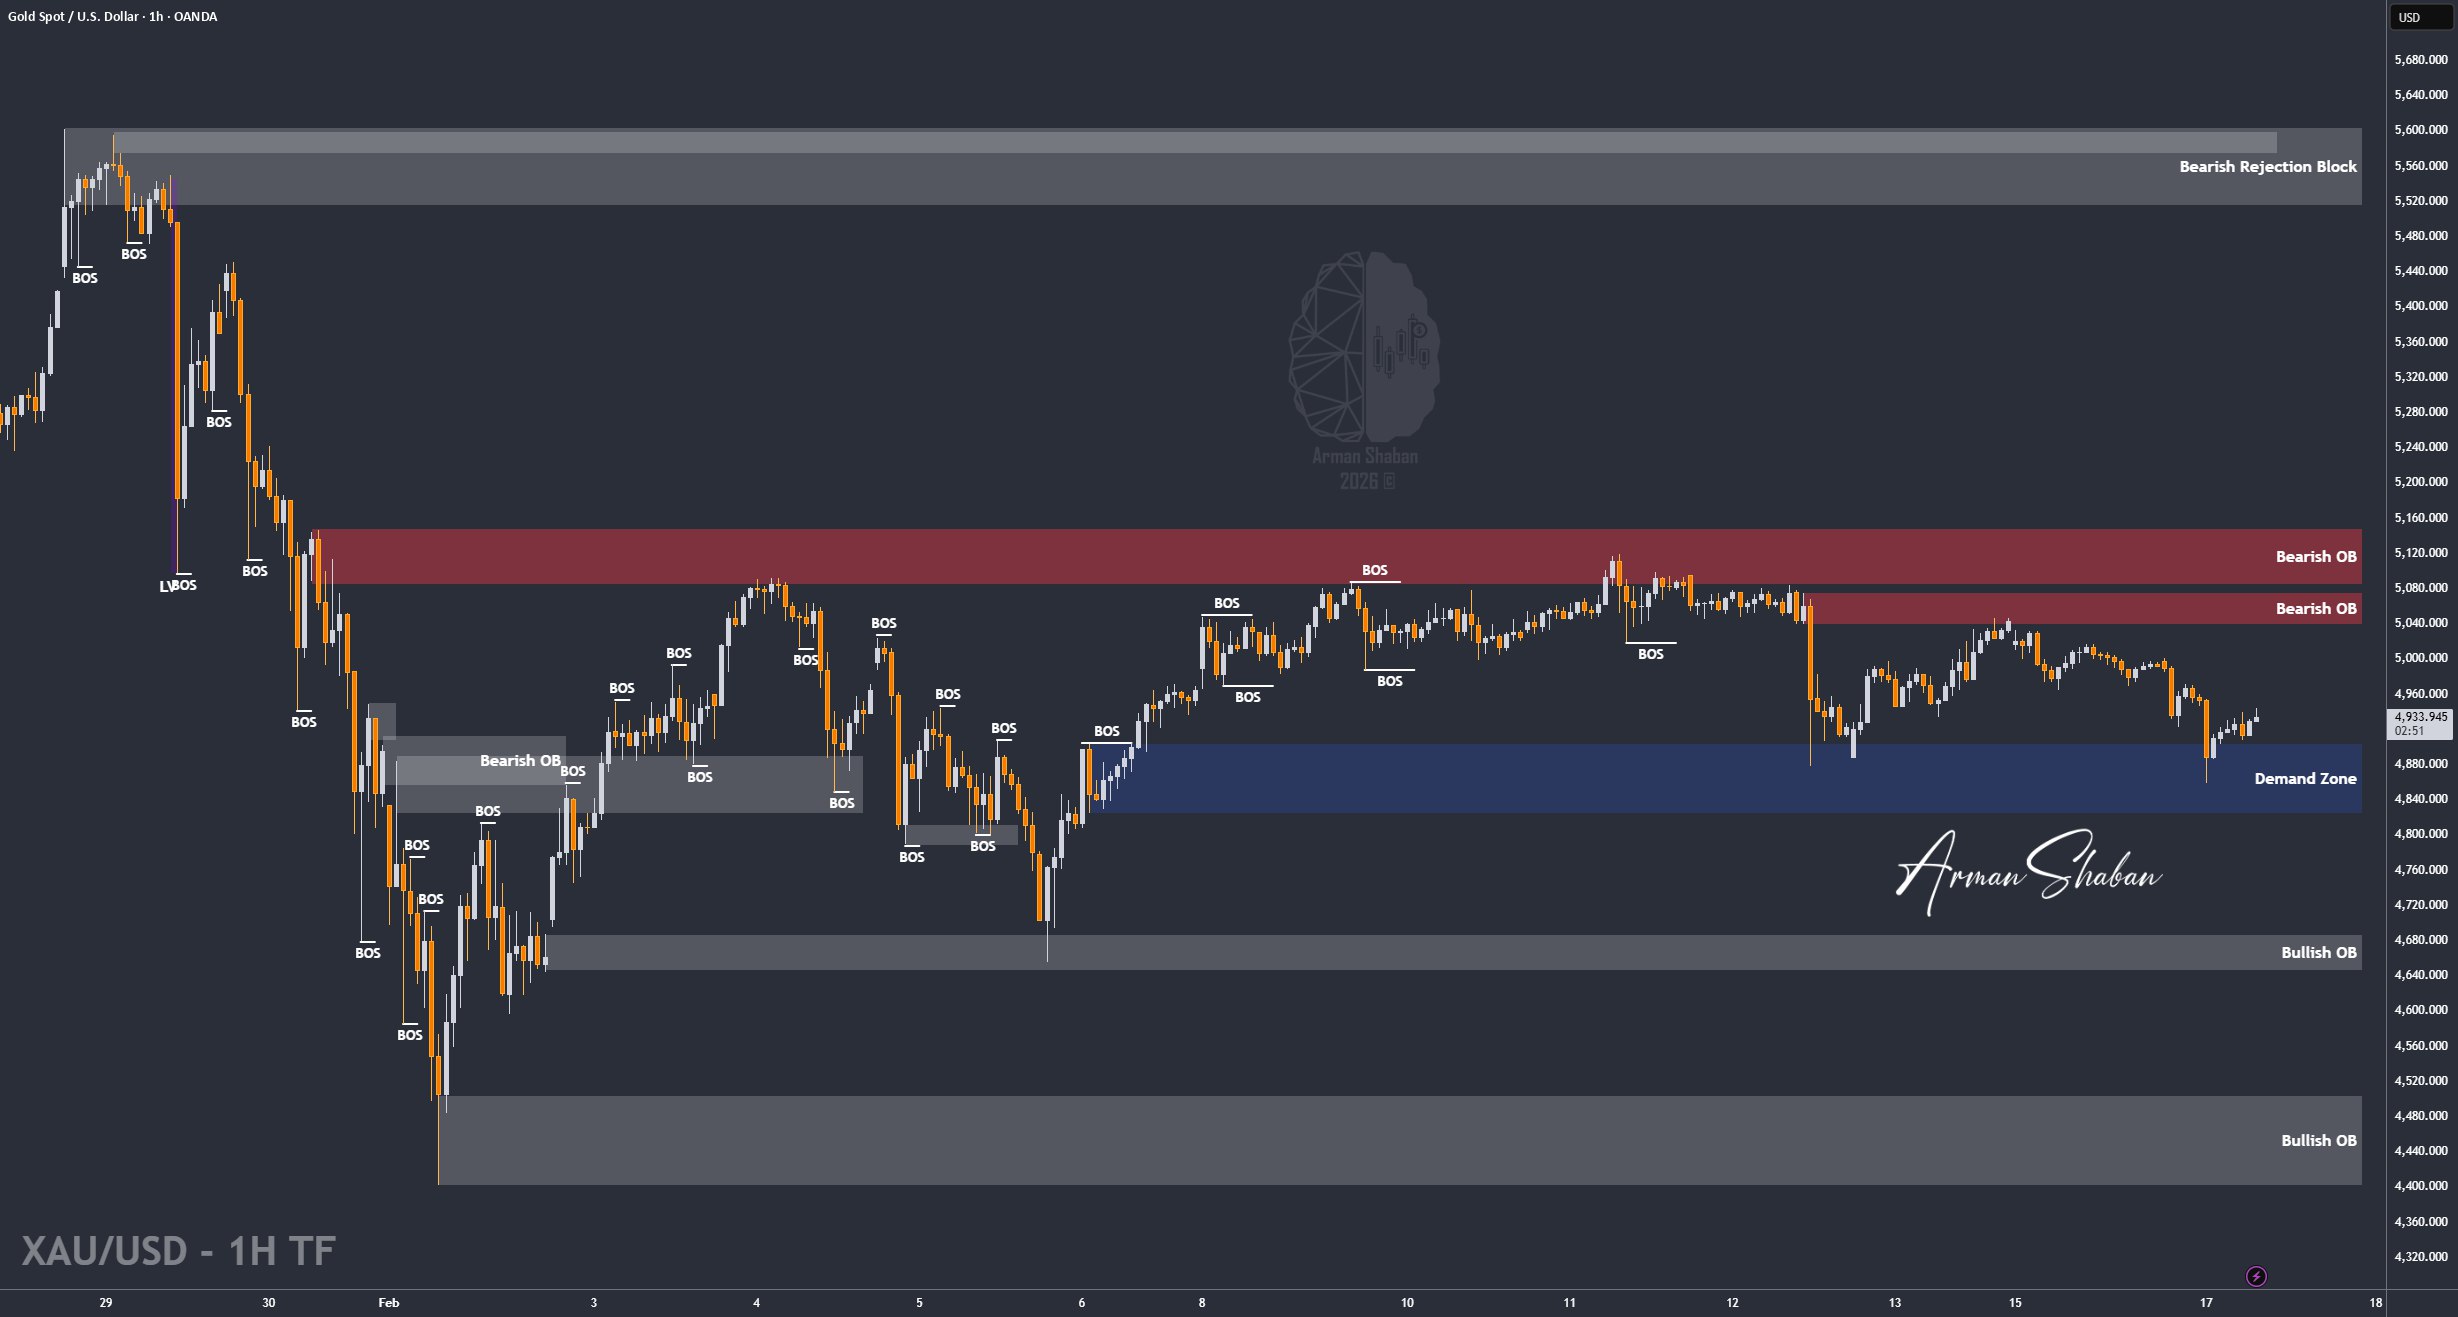
Gold Analysis: By analyzing the #Gold chart on the 1-hour timeframe, we can see that price moved exactly as expected and entered the $5038 to $5077 supply zone. Once Gold reached this area, it faced aggressive selling pressure and experienced a sharp decline down to the $4859 level.
After tapping into that demand zone, buyers stepped in again and price reacted positively. Currently, Gold is trading around the $4934 area, showing a rebound from the recent low. The market structure remains highly reactive between supply and demand zones, and volatility continues to dominate intraday movements.
For potential sell positions, the key supply areas to monitor are $4953 to $4970, followed by $5005, and then the major supply zone between $5030 and $5049. Strong bearish reactions from these levels could provide continuation opportunities to the downside. Keep a close eye on price behavior inside these zones.
(This Post on TradingView)
Author : Arman Shaban
To see more analyzes of Gold , Forex Pairs , Cryptocurrencies , Indices and Stocks , be sure to Follow and Join us on other Platforms :
– Public Telegram Channel
– YouTube Channel
– TradingView
– X (Twitter)
– How to join our FOREX VIP Channel ?
– How to join our Crypto VIP Channel ?
– CONTACT ME directly on Telegram