Gold Analysis – 17.Jun.2026
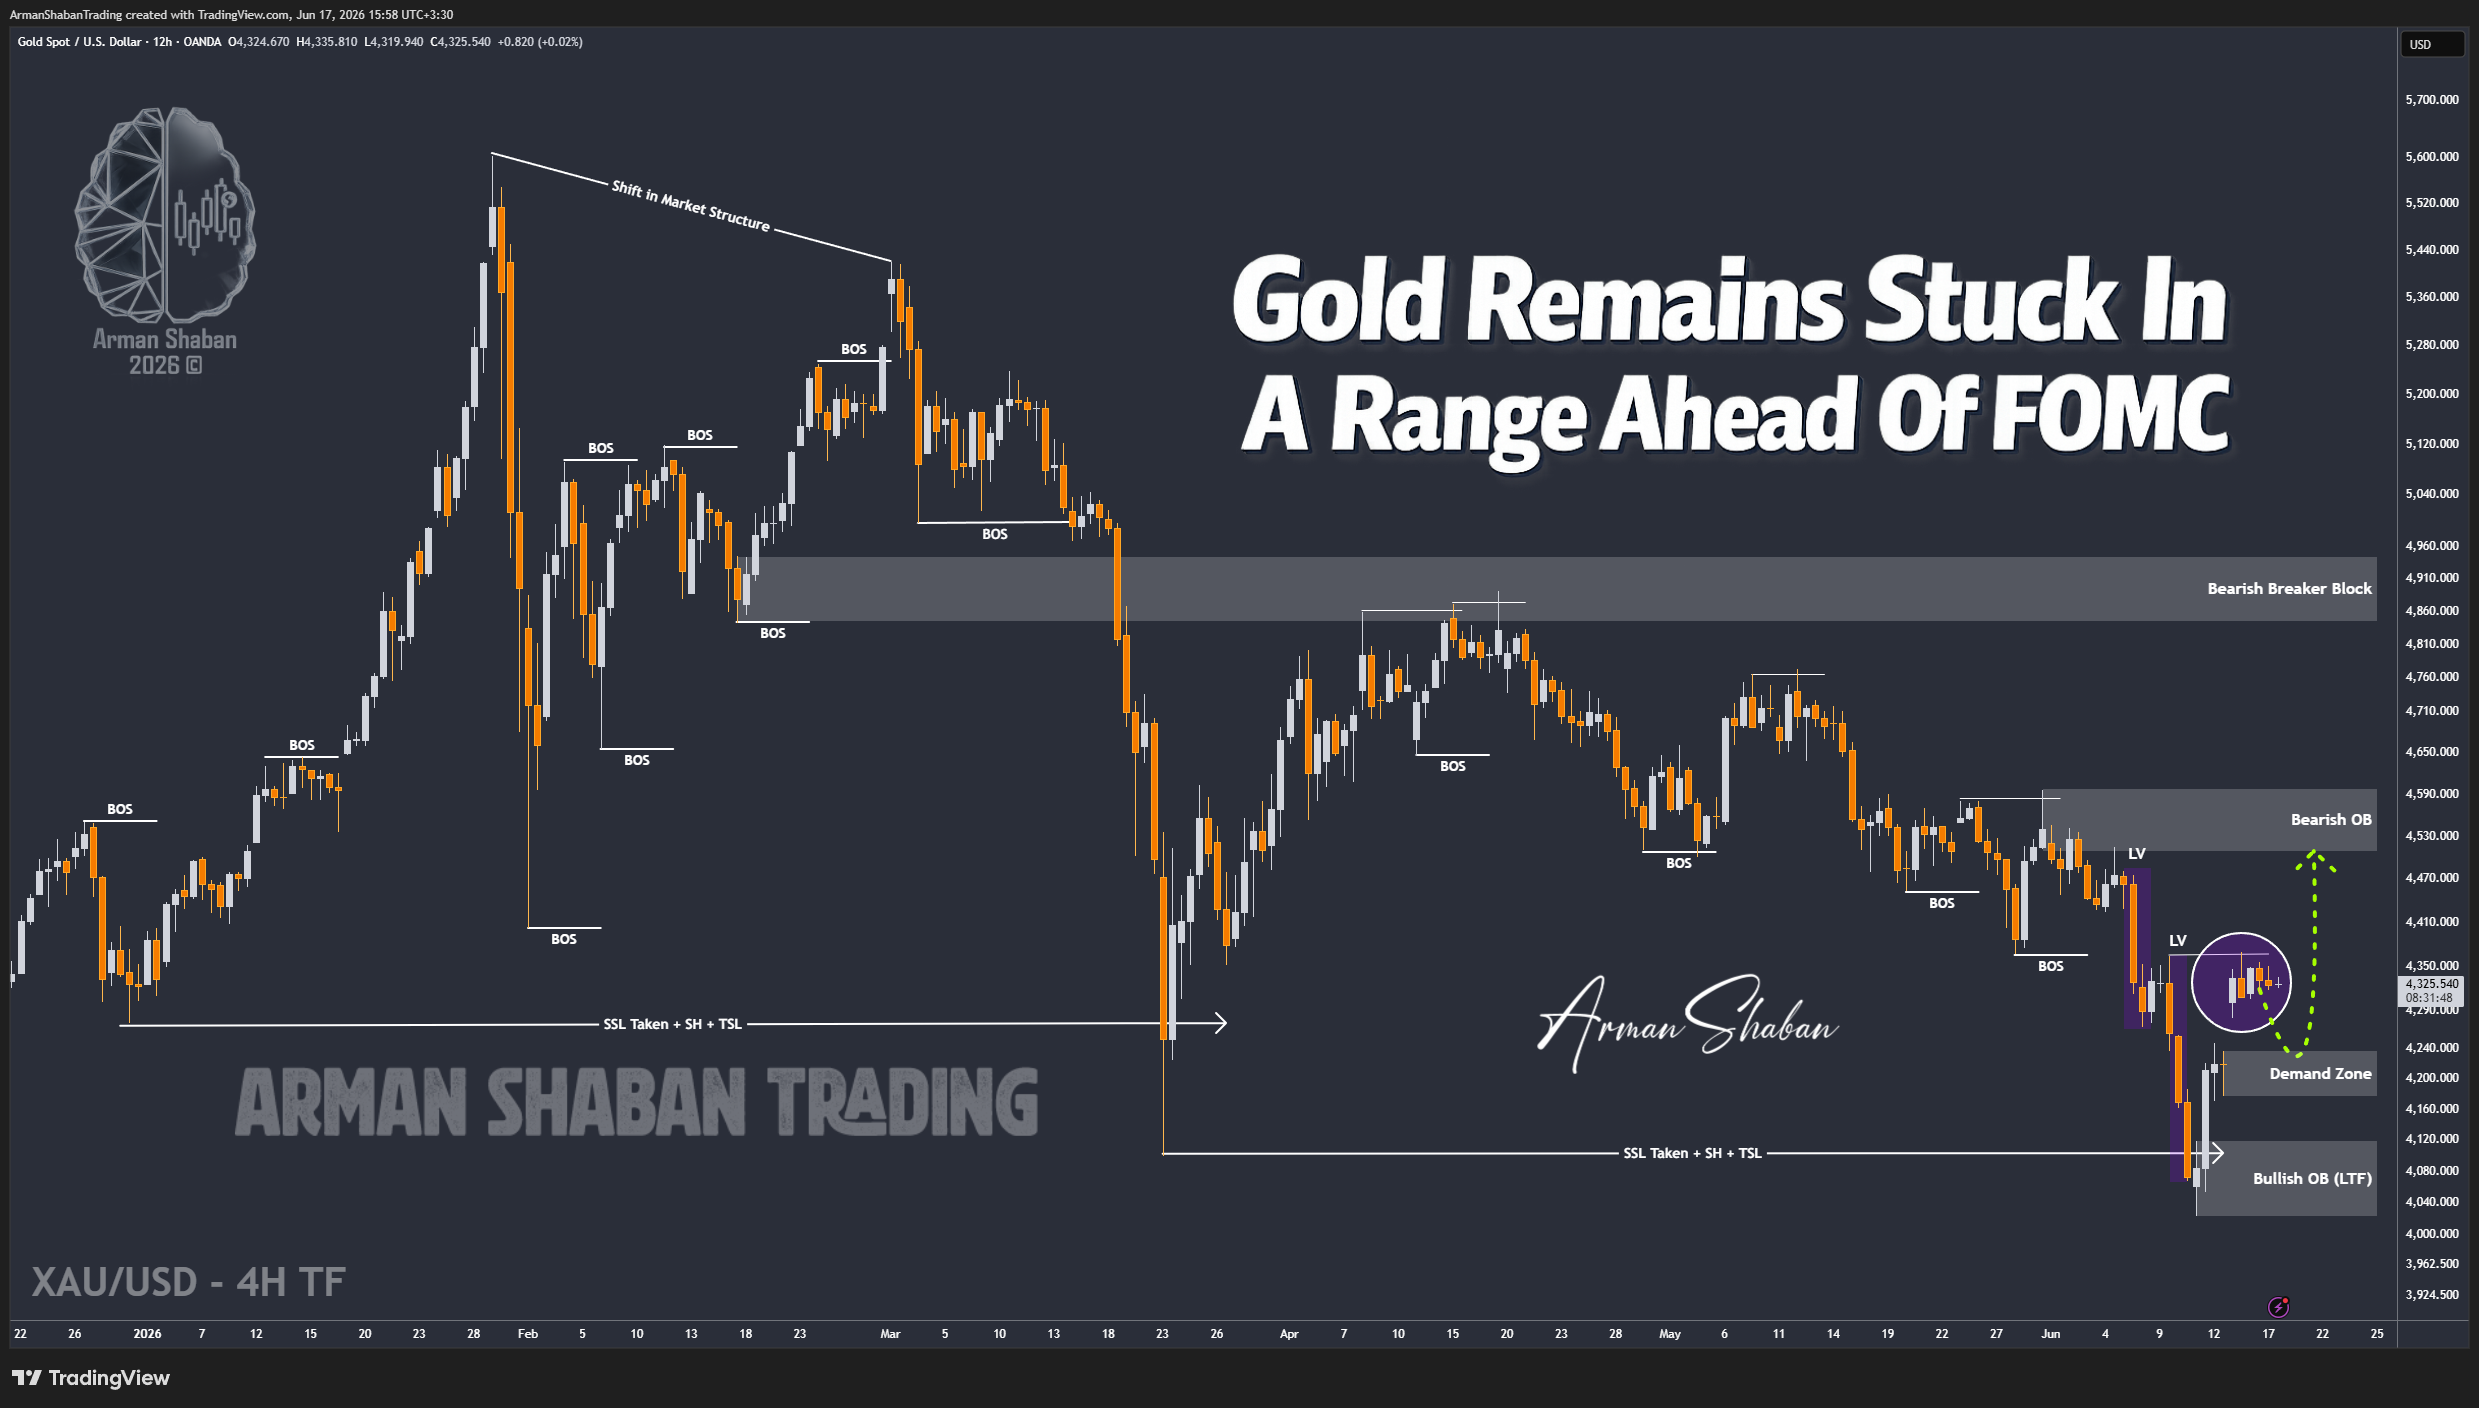
Gold Analysis: By analyzing the #Gold chart on the 4H timeframe, we can see that after our previous update, Gold failed to deliver any significant move and spent the last session consolidating around the $4320 region. Currently, Gold is trading around $4323 and the market is clearly waiting for today’s FOMC meeting before committing to the next major direction.
In my view, today may not provide the best trading opportunities. The FOMC statement, economic projections, and especially the tone and comments from Fed Chairman Kevin Warsh could finally inject volatility into the market. For now, patience and proper risk management remain the priority.
From a structural perspective, the nearest supply zones are located around $4345 – $4370, followed by a stronger resistance cluster between $4420 – $4460. On the downside, the closest demand zones are located around $4235 – $4280, with deeper support sitting between $4177 – $4235.
Despite this prolonged consolidation, my broader bias remains bearish. I still expect Gold to move lower first and enter the major demand zone between $4177 and $4235. Once price reaches this area, I believe buyers could step in again and trigger the next bullish wave.
For now, today’s FOMC meeting is likely to become the catalyst that finally wakes the market up and determines the next major move.
(This Post on TradingView)
Author : Arman Shaban
To see more analyzes of Gold , Forex Pairs , Cryptocurrencies , Indices and Stocks , be sure to Follow and Join us on other Platforms :
– Public Telegram Channel
– YouTube Channel
– TradingView
– X (Twitter)
– How to join our FOREX VIP Channel ?
– How to join our Crypto VIP Channel ?
– CONTACT ME directly on Telegram