Ethereum Analysis – 06.Nov.2025
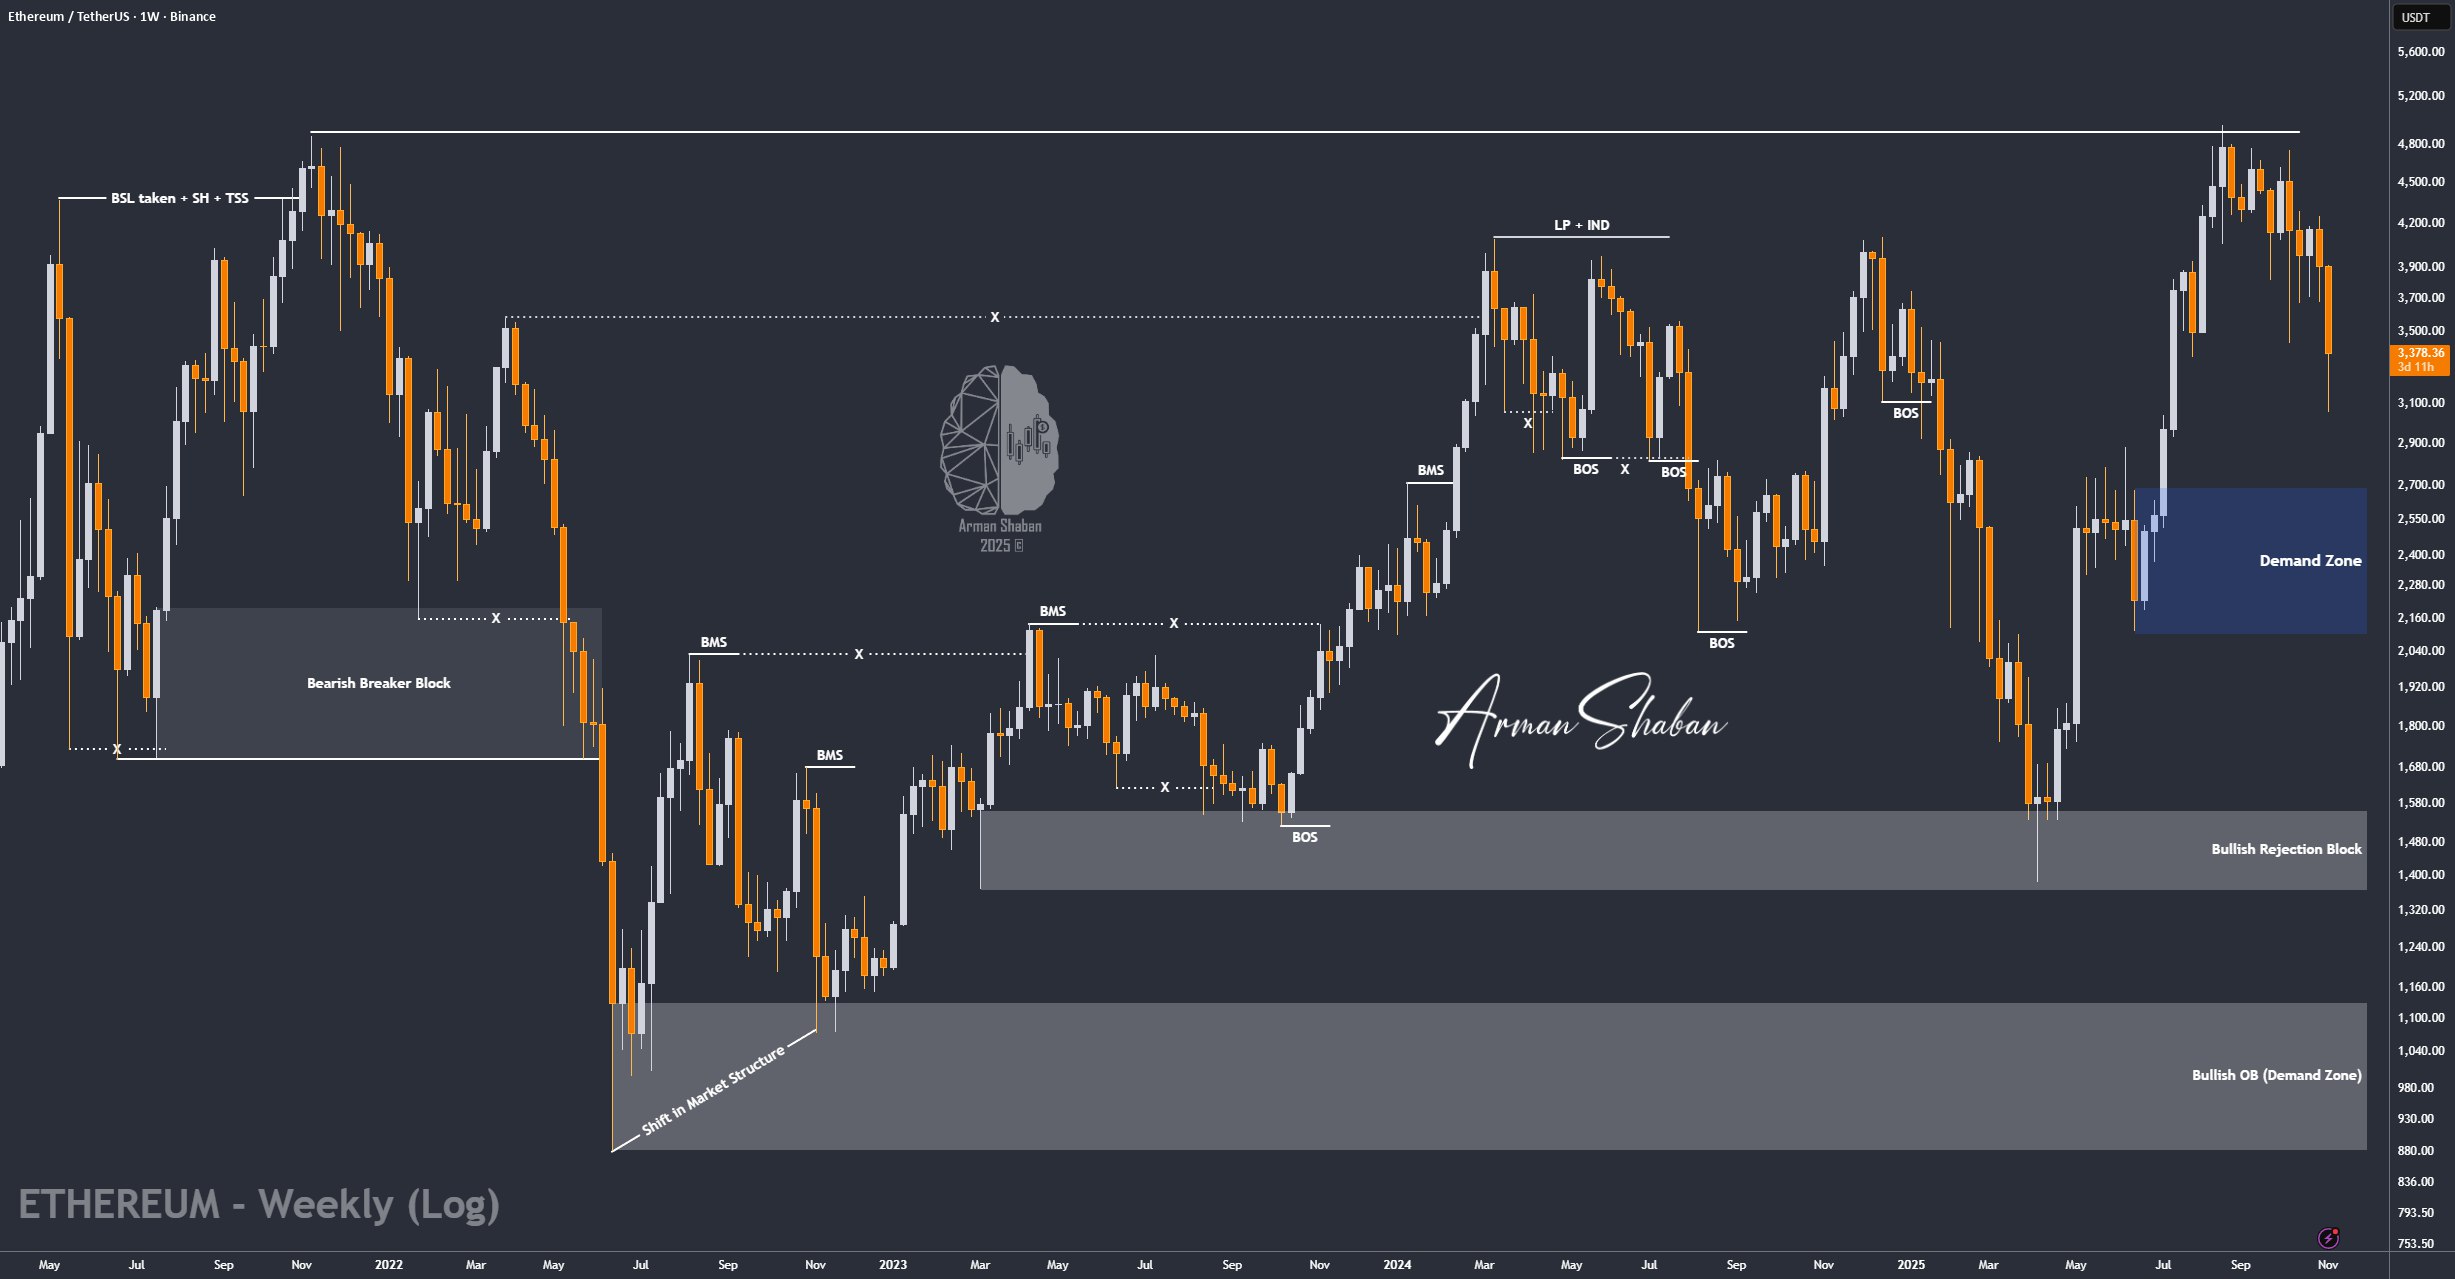
Ethereum Analysis: By analyzing the #Ethereum chart on the weekly timeframe, we can see that Ethereum, similar to Bitcoin, has started a correction — dropping as low as $3,050 earlier today and now trading around $3,300. Key demand zones to watch are at $2,900, $2,700, and especially $2,500, which is a major support area. If price dips into this zone, I expect a strong bullish reaction from buyers. This analysis will be updated once confirmation appears on the chart.
(This Post on TradingView)
Author : Arman Shaban
To see more analyzes of Gold , Forex Pairs , Cryptocurrencies , Indices and Stocks , be sure to Follow and Join us on other Platforms :
– Public Telegram Channel
– YouTube Channel
– TradingView
– X (Twitter)
– How to join our FOREX VIP Channel ?
– How to join our Crypto VIP Channel ?
– CONTACT ME directly on Telegram