USD/JPY Analysis – 07.Jul.2026
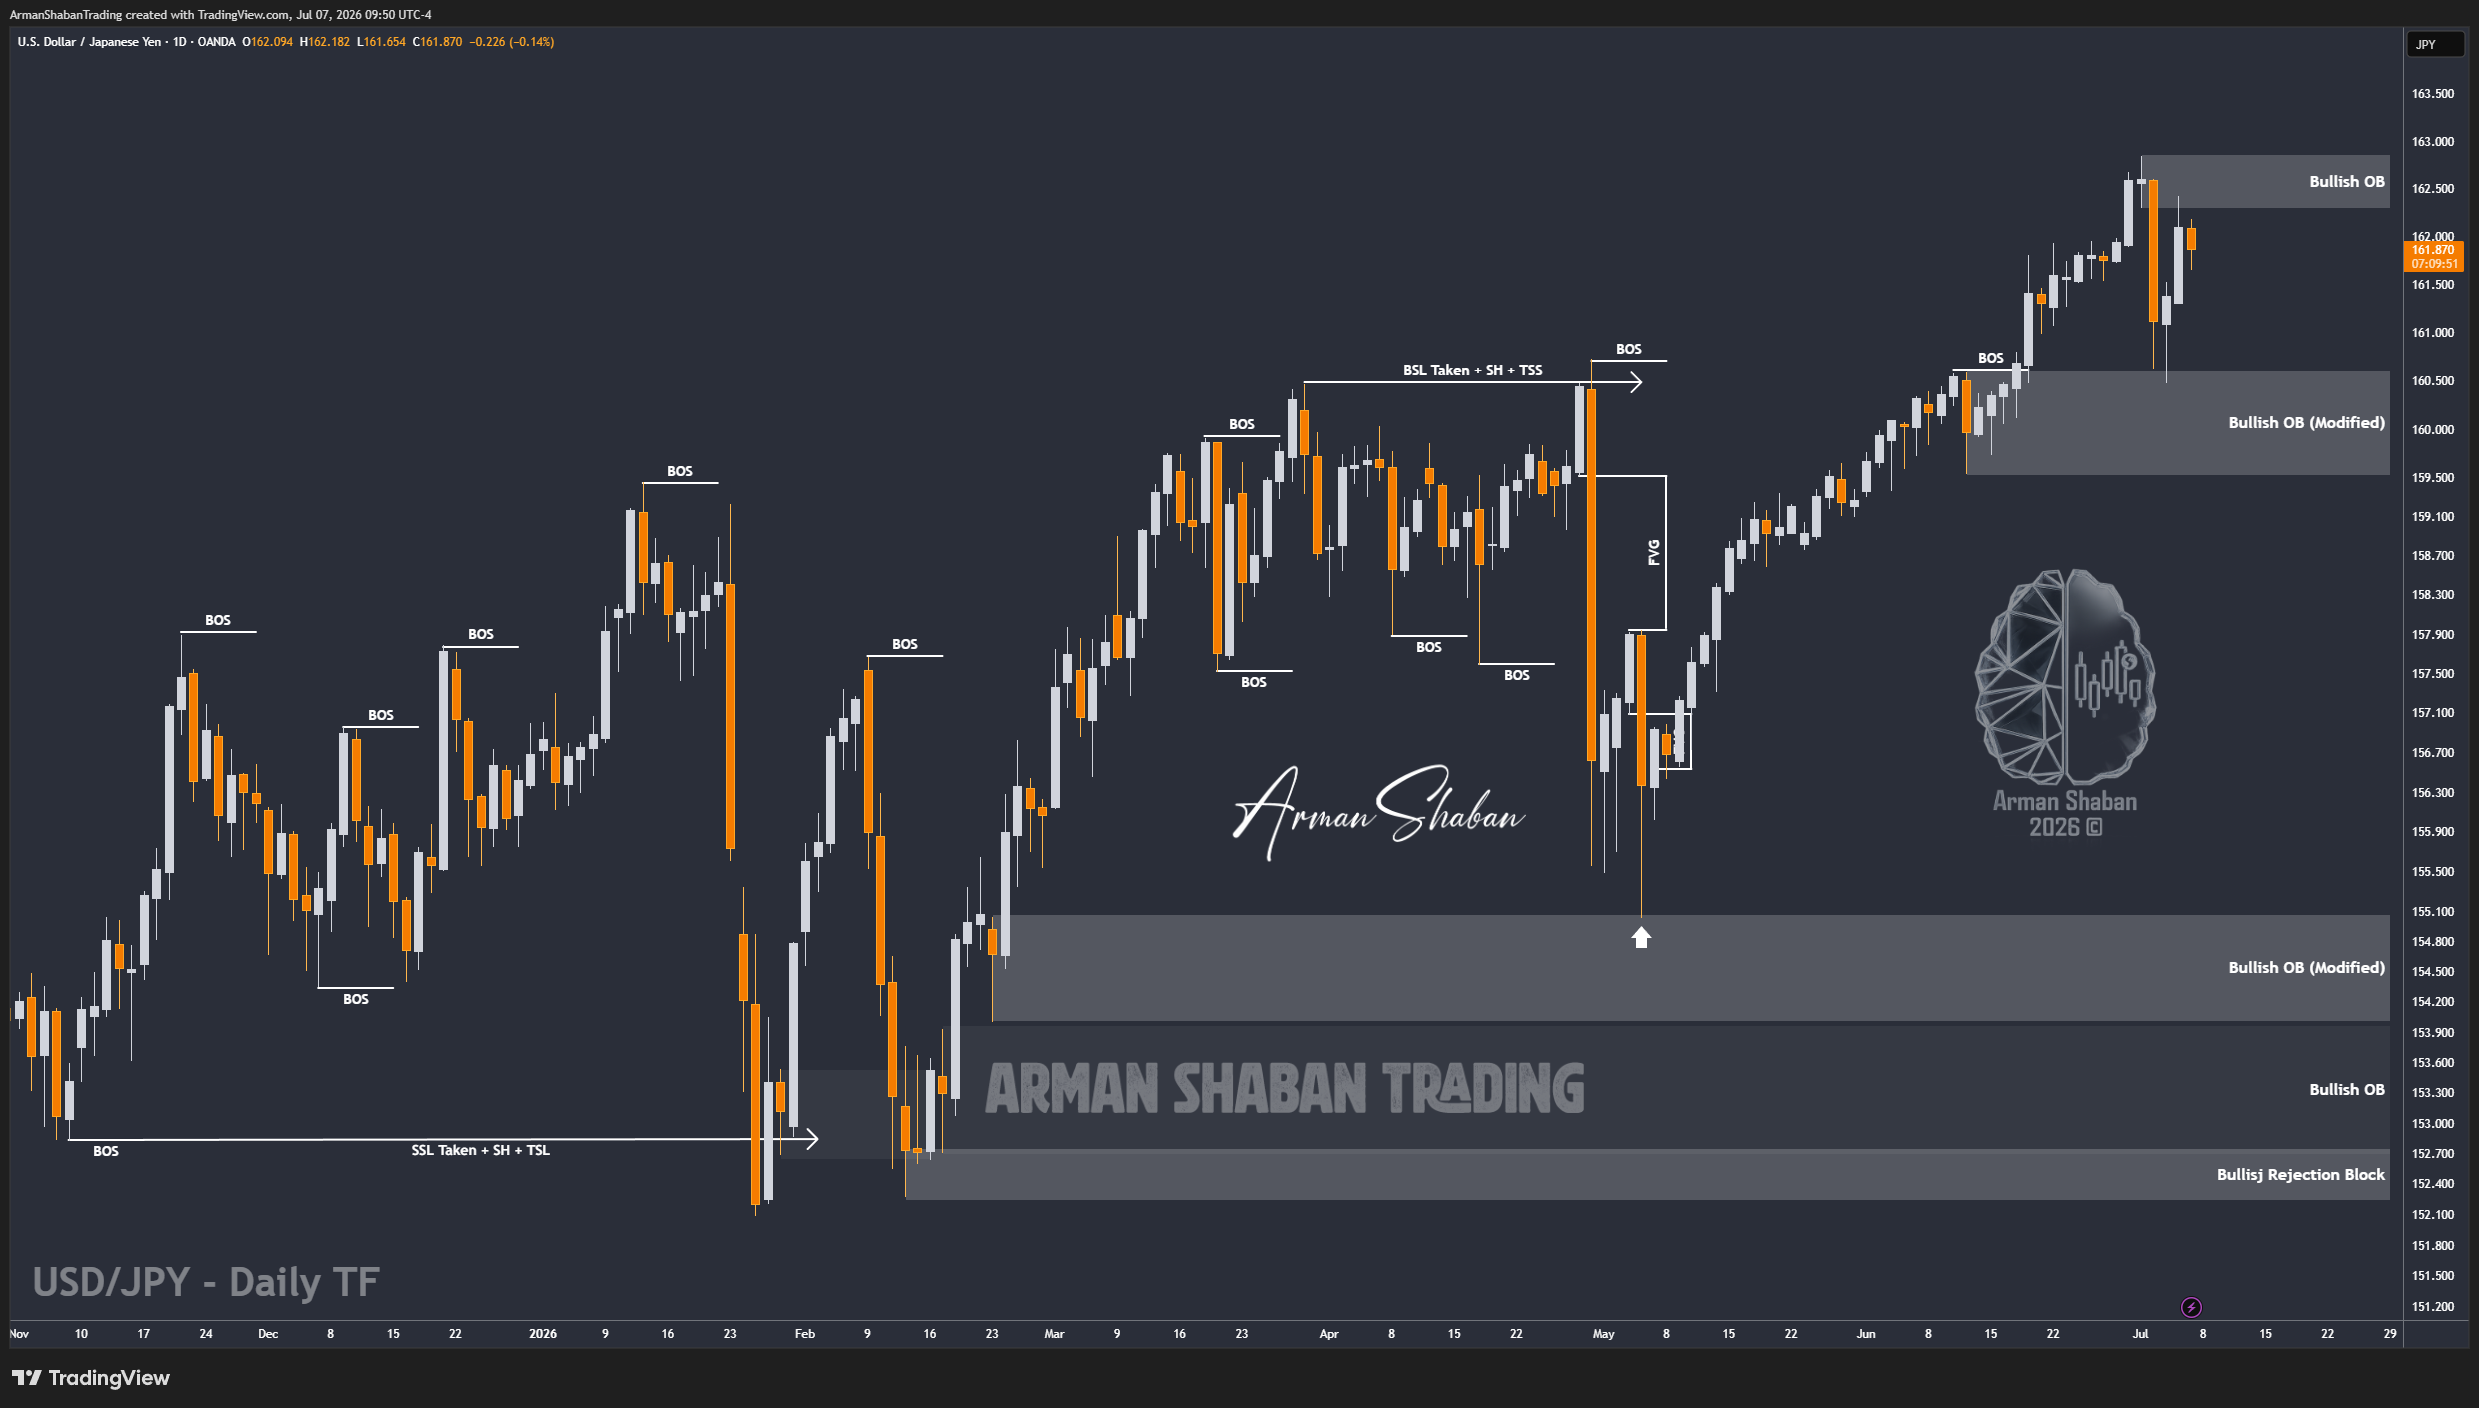
USD/JPY Analysis : By analyzing the #USDJPY chart on the Daily timeframe, we can see that price reacted exactly as expected from the key supply zone discussed in the previous analysis. After trading around the 162.37 region, USDJPY started to reject from this area and dropped more than 75 pips, reaching the 161.65 region. This confirms that sellers are still active around the upper resistance zone. For now, all assumptions from the previous analysis remain valid. As long as price stays below the 162.00 – 162.85 supply zone, I still expect further downside continuation.
The next downside targets to monitor are 161.50, followed by 160.50, then 159.20, and potentially 158.00 if bearish momentum continues to build. However, if price breaks and stabilizes above 162.85, the bearish scenario would weaken and USDJPY could push toward new higher levels again. This analysis will be updated as the market evolves.
(This Post on TradingView)
Author : Arman Shaban
To see more analyzes of Gold , Forex Pairs , Cryptocurrencies , Indices and Stocks , be sure to Follow and Join us on other Platforms :
– Public Telegram Channel
– YouTube Channel
– TradingView
– X (Twitter)
– How to join our FOREX VIP Channel ?
– How to join our Crypto VIP Channel ?
– CONTACT ME directly on Telegram

