Gold Analysis – 27.Apr.2026
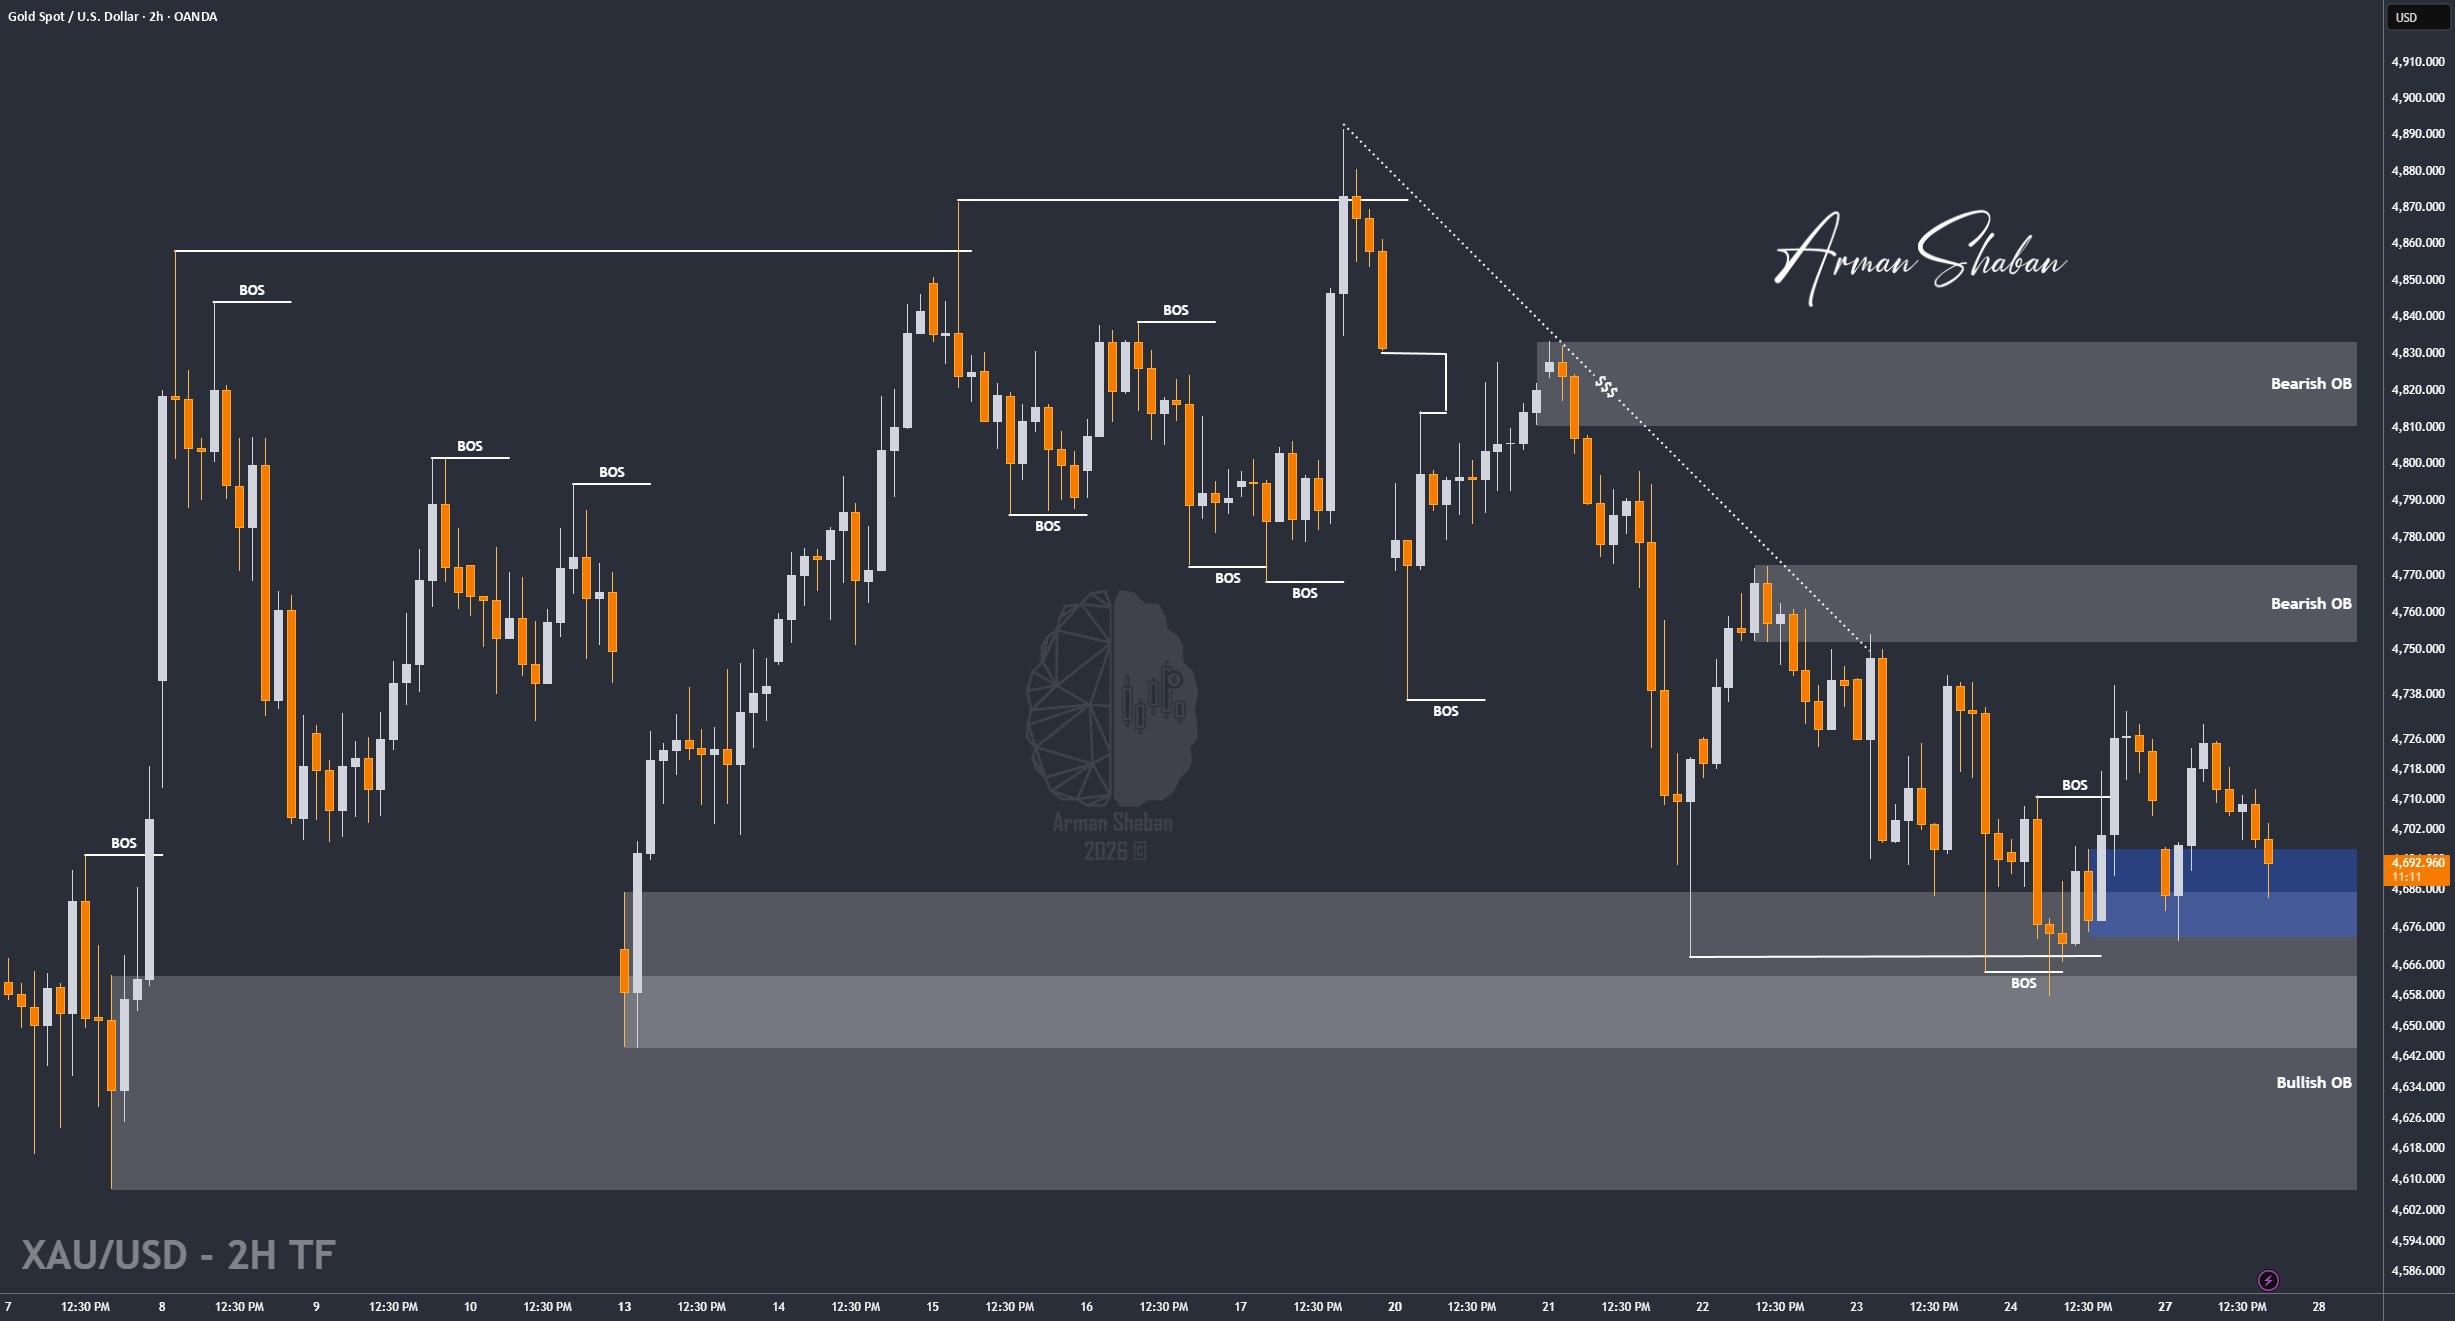
Gold Analysis: By analyzing the #Gold chart on the 4H timeframe, we can see that price opened the week with a bearish gap down to around $4672, but buyers quickly stepped in and pushed it back up toward $4739. However, this move lacked continuation and price is now trading around the $4692 region, sitting right at a critical support area.
From a structural perspective, the $4680 – $4700 zone is currently acting as a key demand area. As long as price manages to hold and stabilize above this level, we can expect another bullish attempt toward the nearest supply zones at $4725 – $4750, followed by $4780 – $4820 as the next major resistance cluster. In this case, short-term upside targets would be $4725, $4750, and then $4780.
On the other hand, if price fails to hold above this demand zone and we see a clean breakdown, the market could enter another bearish leg toward lower liquidity levels. In that scenario, the next downside targets would be $4665, followed by $4640, and potentially $4600 as selling pressure builds.
Overall, this is a key reaction zone where the next directional move will likely be determined. Keep in mind that the market remains highly sensitive to geopolitical developments, and any shift in tensions between Iran and the US could quickly change the direction of Gold.
(This Post on TradingView)
Author : Arman Shaban
To see more analyzes of Gold , Forex Pairs , Cryptocurrencies , Indices and Stocks , be sure to Follow and Join us on other Platforms :
– Public Telegram Channel
– YouTube Channel
– TradingView
– X (Twitter)
– How to join our FOREX VIP Channel ?
– How to join our Crypto VIP Channel ?
– CONTACT ME directly on Telegram