Gold Analysis – 08.Oct.2026
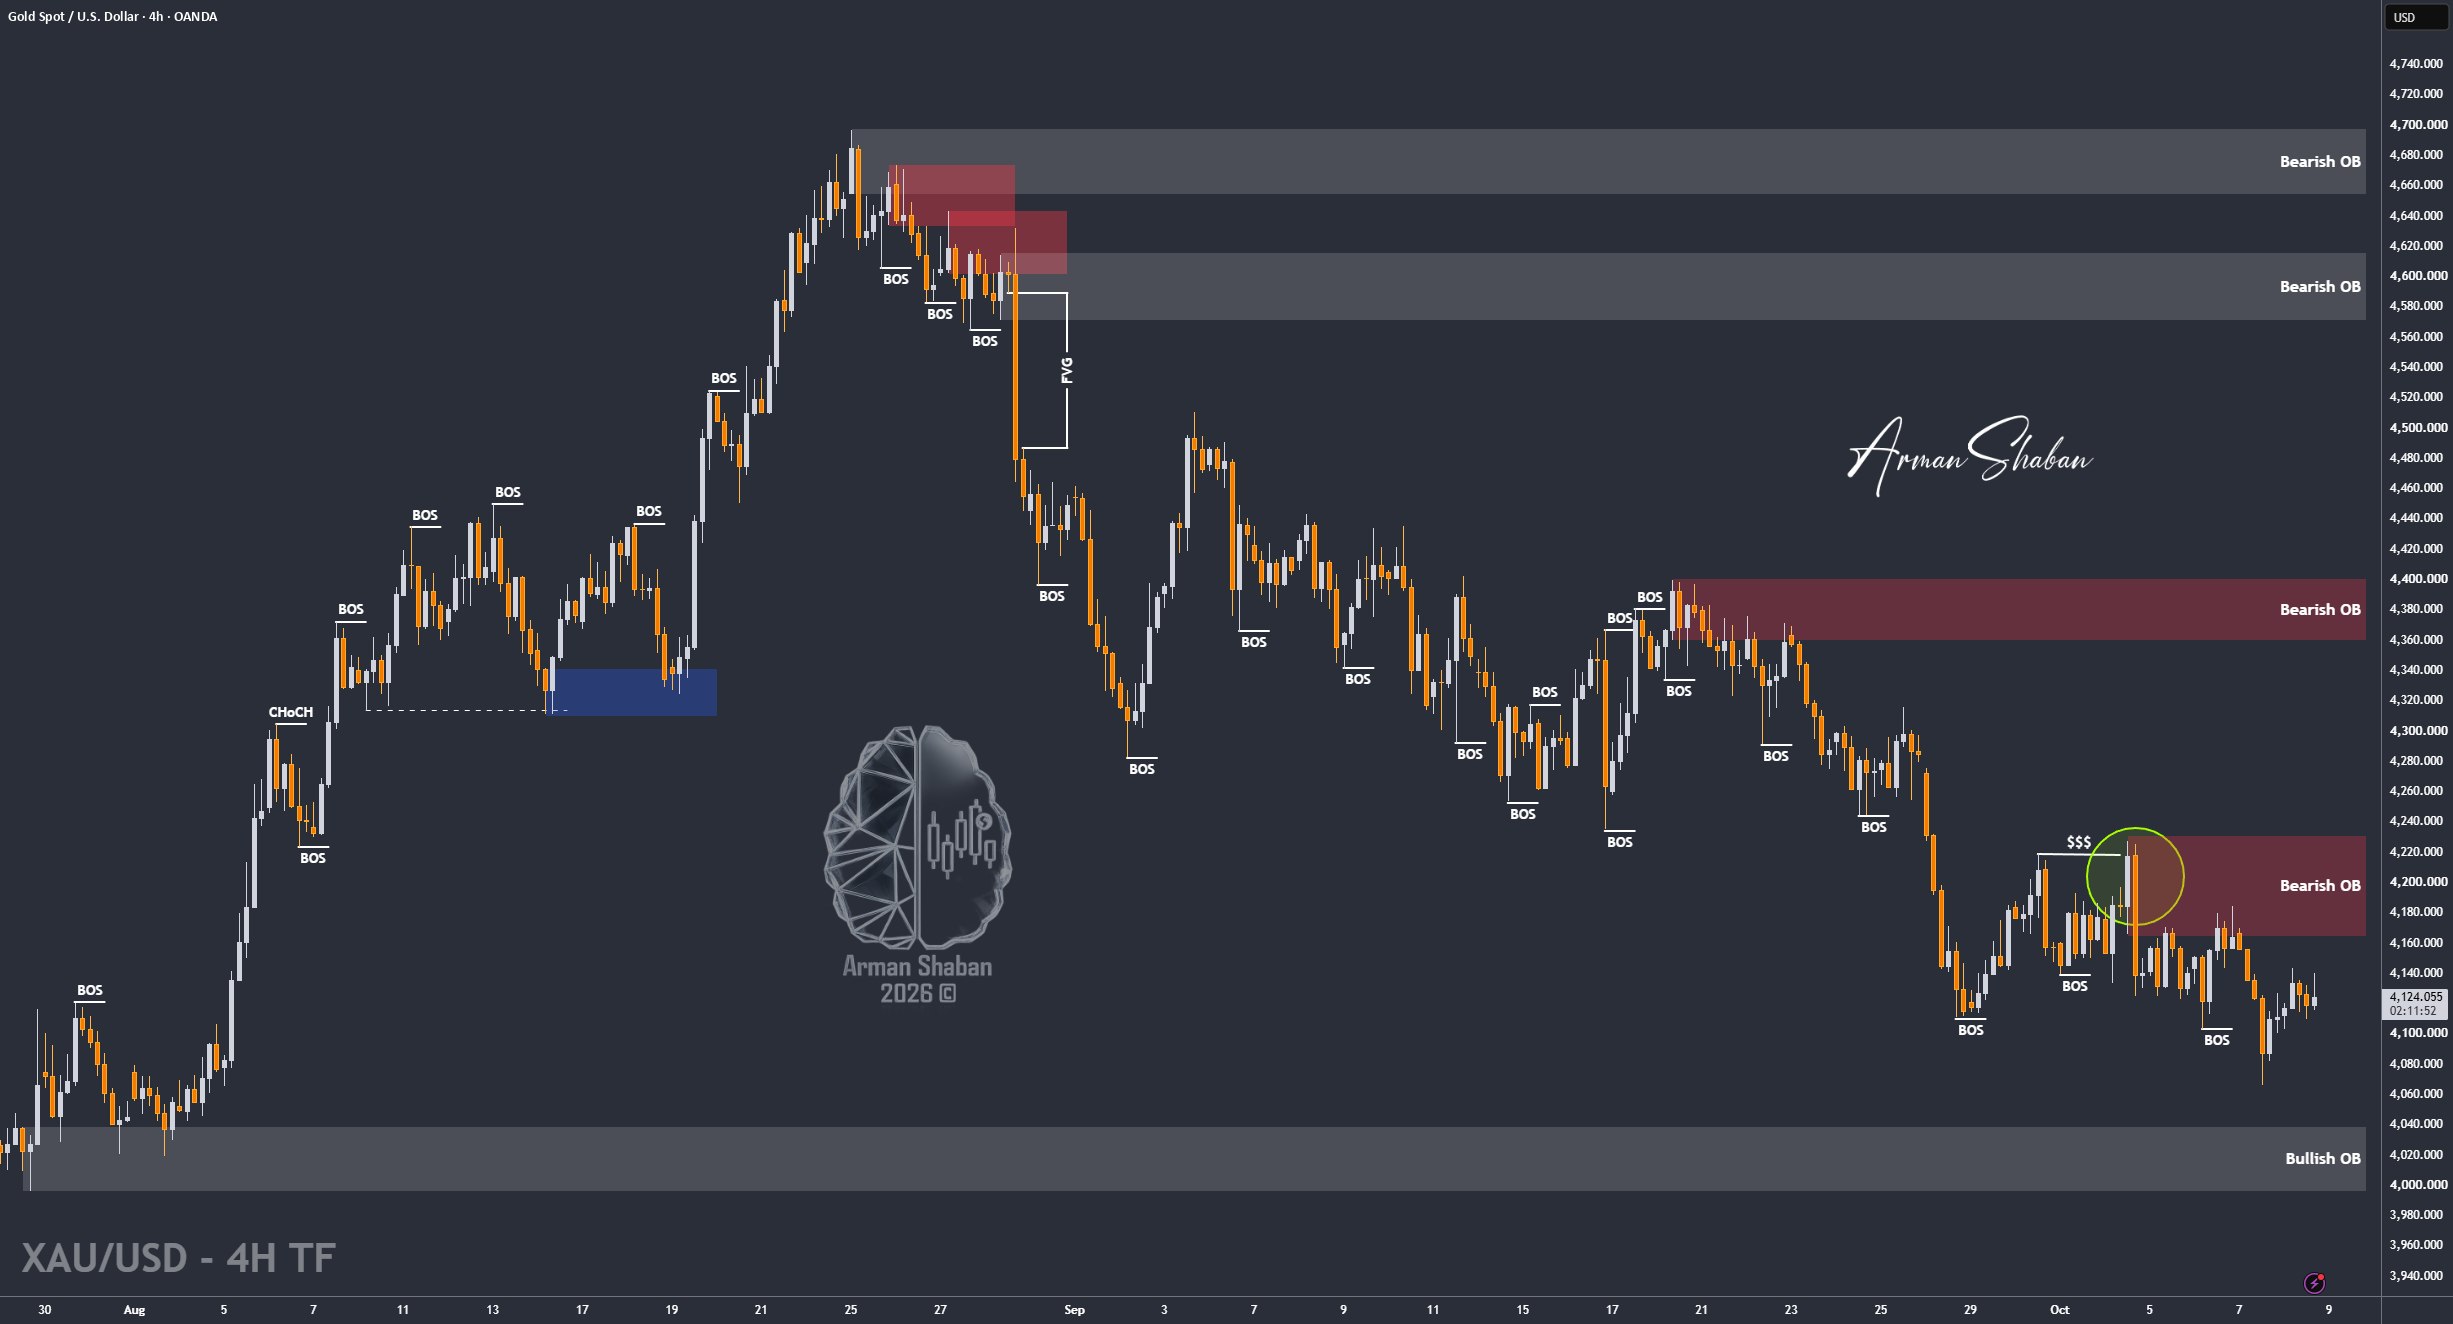
Gold Analysis: By analyzing the #Gold chart on the 4H timeframe, we can see that after the previous analysis, Gold followed our expectations and started recovering toward $4143. However, once price reached this important supply area, sellers stepped in and pushed Gold lower again. Currently, Gold is trading around $4126.
In my view, this recovery was only a temporary correction, and my main bias remains bearish. As long as Gold stays below the nearby supply zones, I expect another bearish move toward lower levels.
The nearest supply zones are around $4140 – $4160, followed by the stronger $4170 – $4190 area. On the downside, the important demand zones are $4115 – $4130, followed by $4060 – $4080, $4030 – $4050 and $4000 – $4020.
If Gold breaks below $4115 and closes a 4H candle underneath this level, the next downside targets I’m watching are $4100, $4080, $4065, $4040, $4020 and potentially $4000 if selling pressure continues.
However, if buyers reclaim $4160 and manage to stabilize above it, the immediate bearish scenario would weaken. A move above $4190 would require a broader reassessment.
For now, I still expect further downside, but price reactions around these important levels will determine the next move.
(This Post on TradingView)
Author : Arman Shaban
To see more analyzes of Gold , Forex Pairs , Cryptocurrencies , Indices and Stocks , be sure to Follow and Join us on other Platforms :
– Public Telegram Channel
– YouTube Channel
– TradingView
– X (Twitter)
– How to join our FOREX VIP Channel ?
– How to join our Crypto VIP Channel ?
– CONTACT ME directly on Telegram

