Ethereum Analysis – 12.Aug.2024
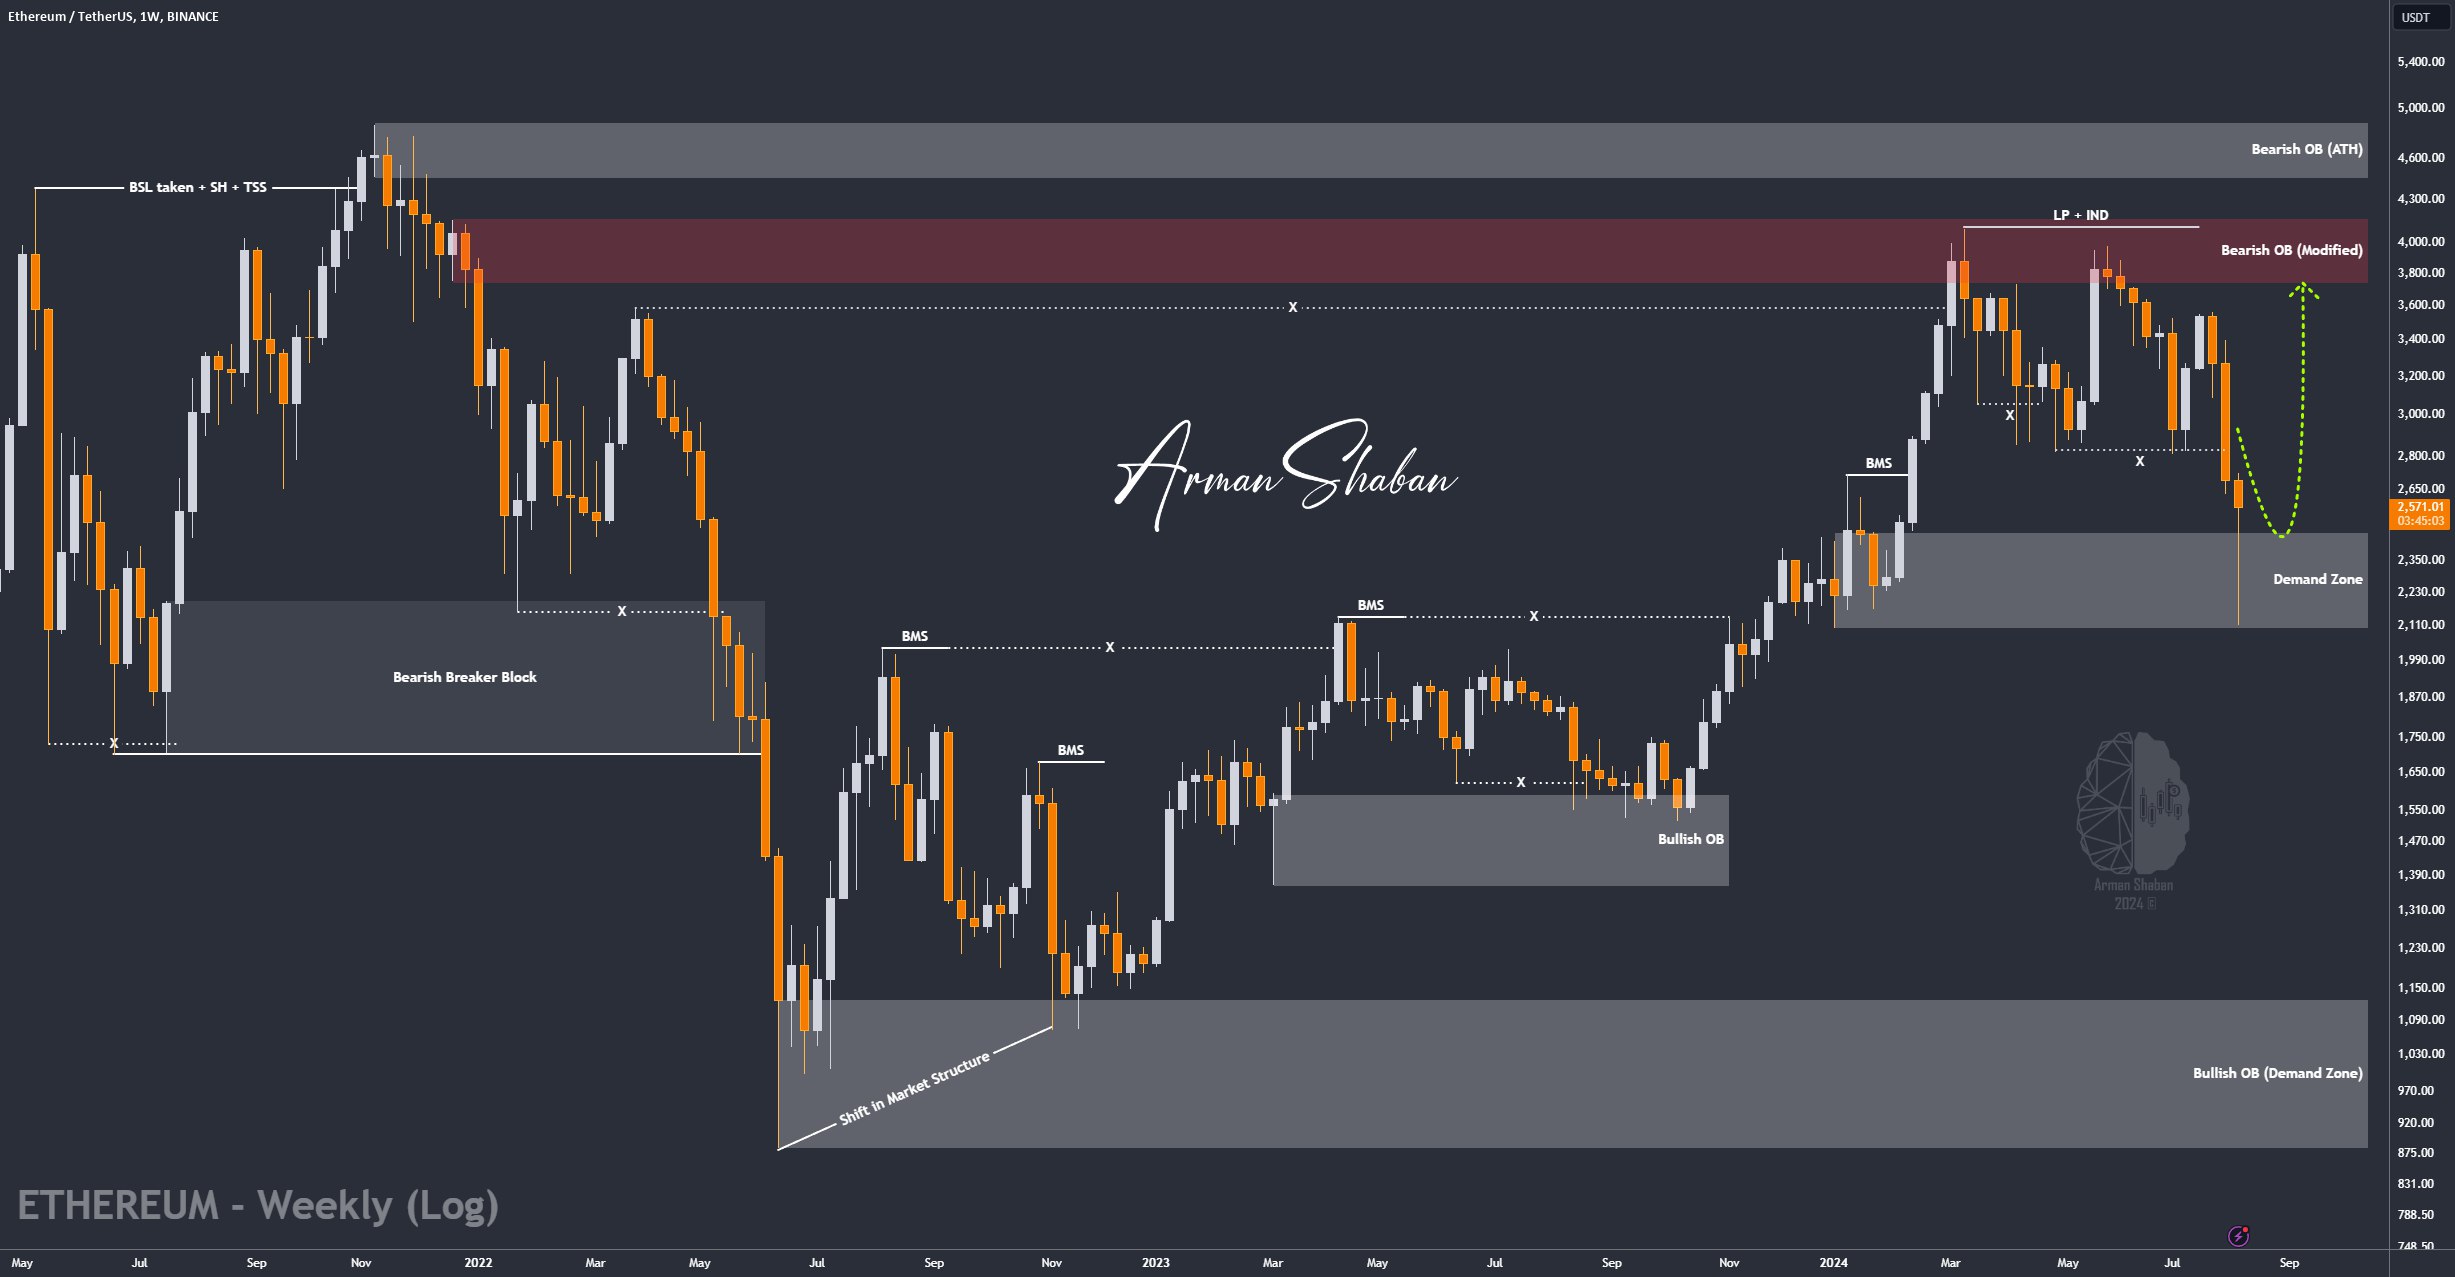
Ethereum Analysis: By examining the #Ethereum chart in the weekly timeframe (logarithmic), we observe that last week, the price entered the desired demand zone and, after dropping to $2110, encountered buying pressure again. Currently, it has managed to rise over 20% and is trading around $2500. As you know, this support level is crucial for the beginning of the next bullish trend, and if the price stabilizes above this zone, we can expect further upward movement to higher levels.
(This Post on TradingView)
Author : Arman Shaban
To see more analyzes of Gold , Forex Pairs , Cryptocurrencies , Indices and Stocks , be sure to Follow and Join us on other Platforms :
– Public Telegram Channel
– YouTube Channel
– TradingView
– X (Twitter)
– How to join our FOREX VIP Channel ?
– How to join our Crypto VIP Channel ?
– CONTACT ME directly on Telegram