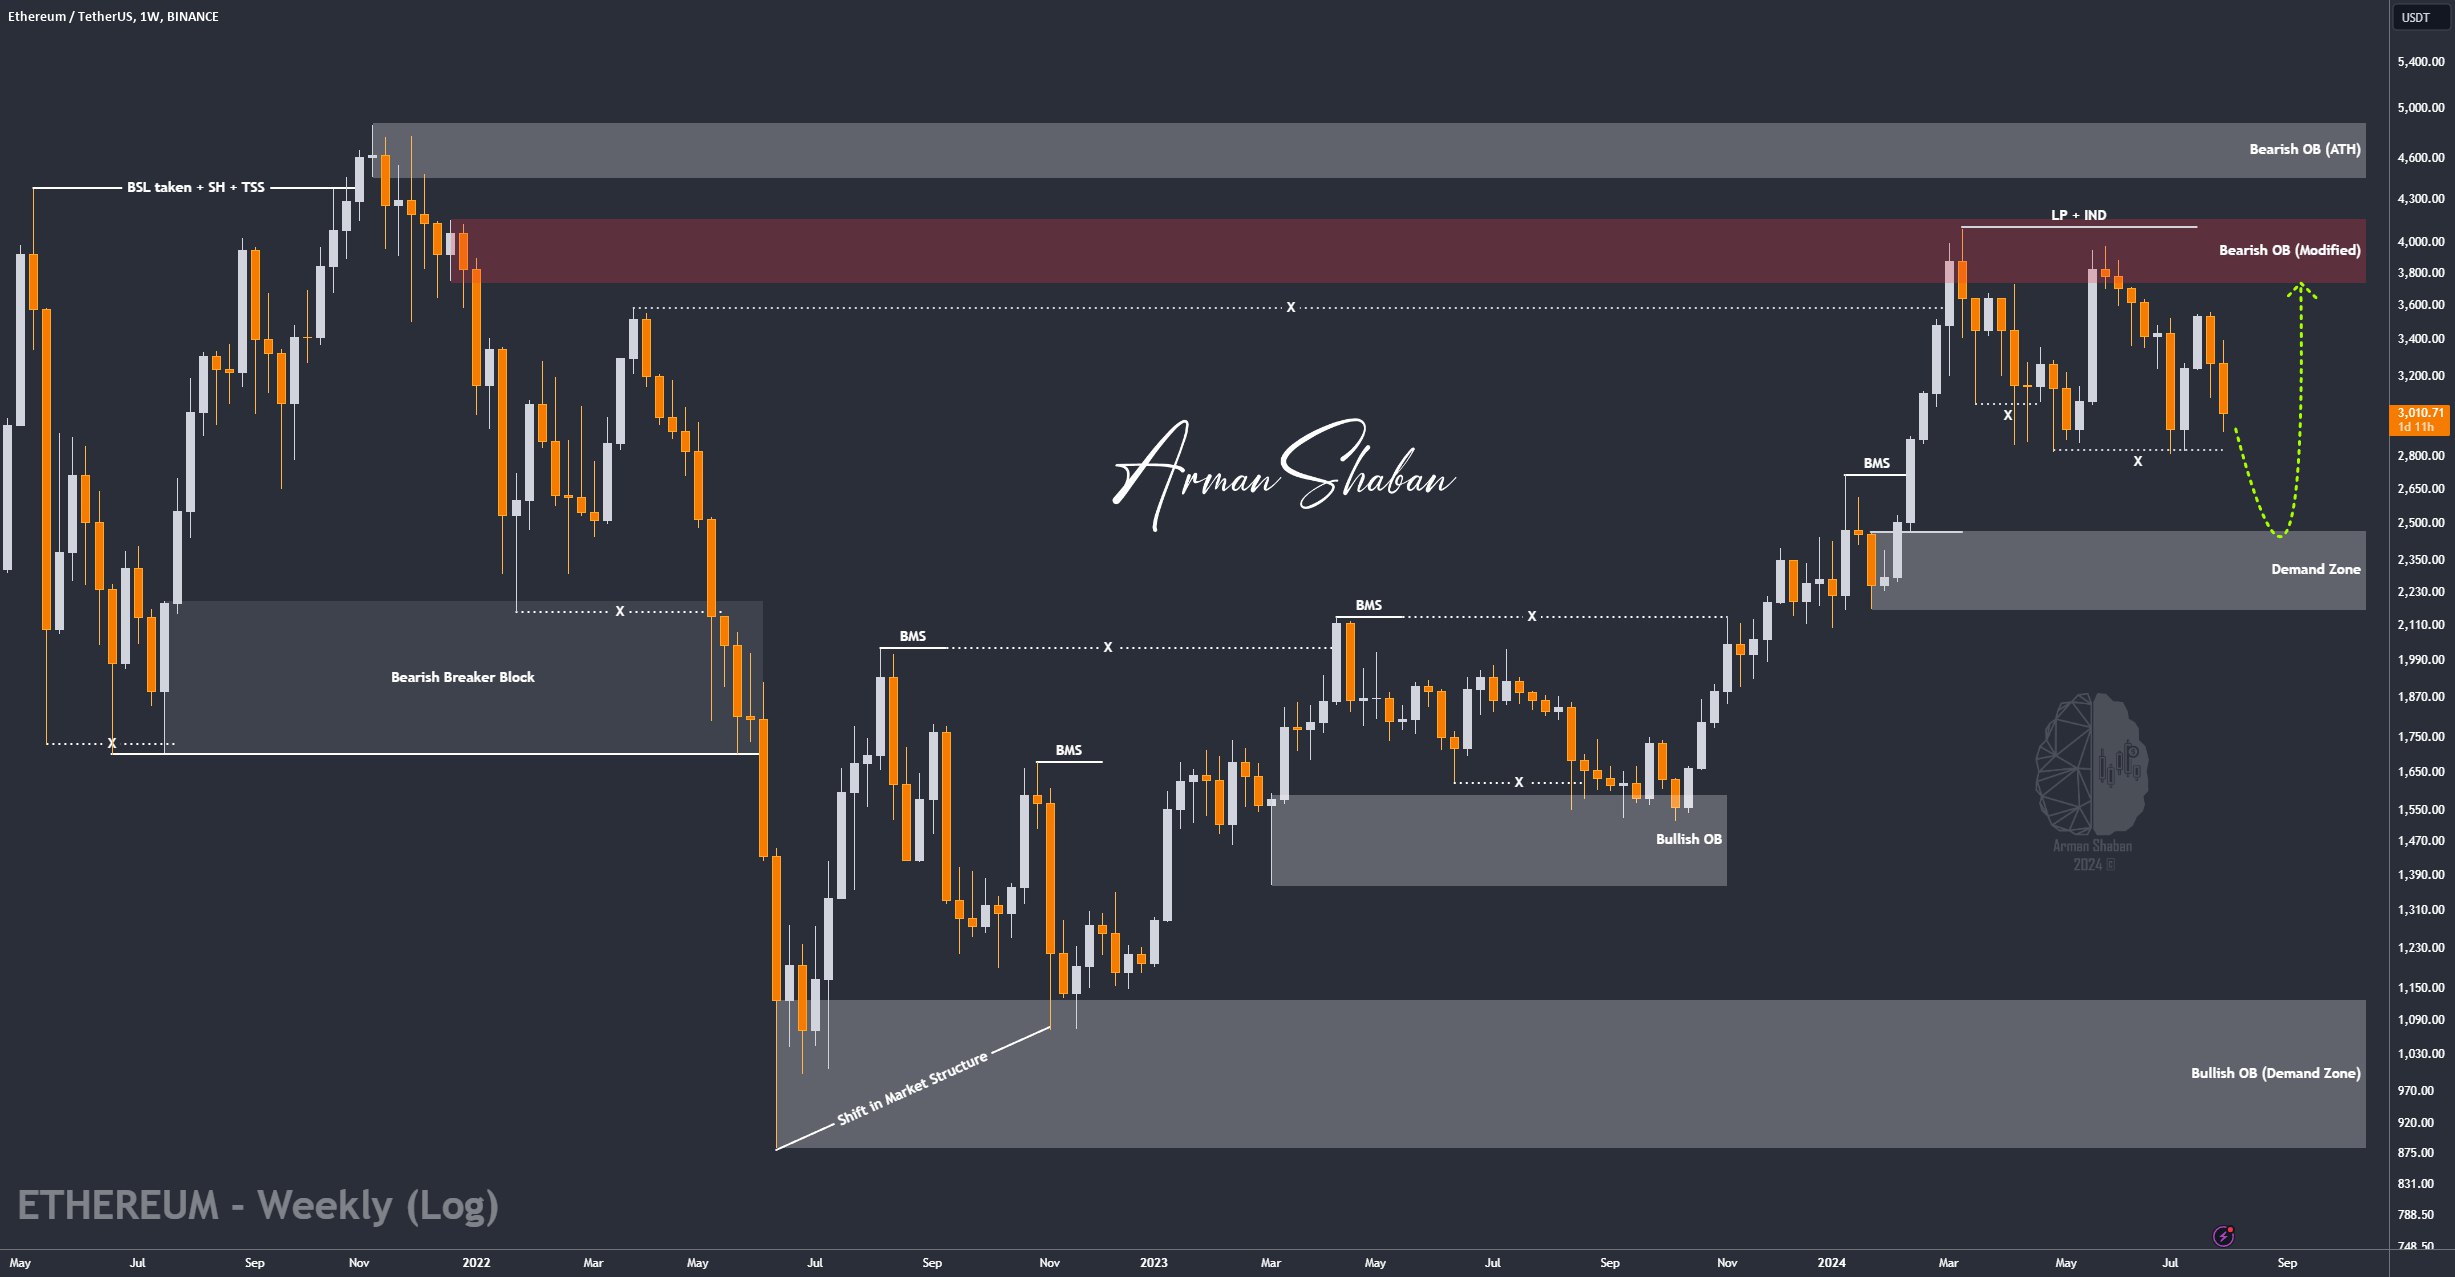
Ethereum Analysis – 03.Aug.2024

Ethereum Analysis: By analyzing the #Ethereum chart on the weekly (logarithmic) time frame, we observe that after the price reached the Bearish OB zone between $3750 and $4150, it faced selling pressure and corrected down to $2800. Currently, the price is trading around $3000, and we need to see if the support at the $2900 level can hold. In my opinion, Ethereum might correct down to $2500 before starting its next bullish move, driven by increased demand in that area. The important demand levels are $2176 to $2500 and $1367 to $1592. The long-term targets for the price are $4100 and $4880.
(This Post on TradingView)
Author : Arman Shaban
To see more analyzes of Gold , Forex Pairs , Cryptocurrencies , Indices and Stocks , be sure to Follow and Join us on other Platforms :
– Public Telegram Channel
– YouTube Channel
– TradingView
– X (Twitter)
– How to join our FOREX VIP Channel ?
– How to join our Crypto VIP Channel ?
– CONTACT ME directly on Telegram