Bitcoin Analysis – 20.Jul.2026
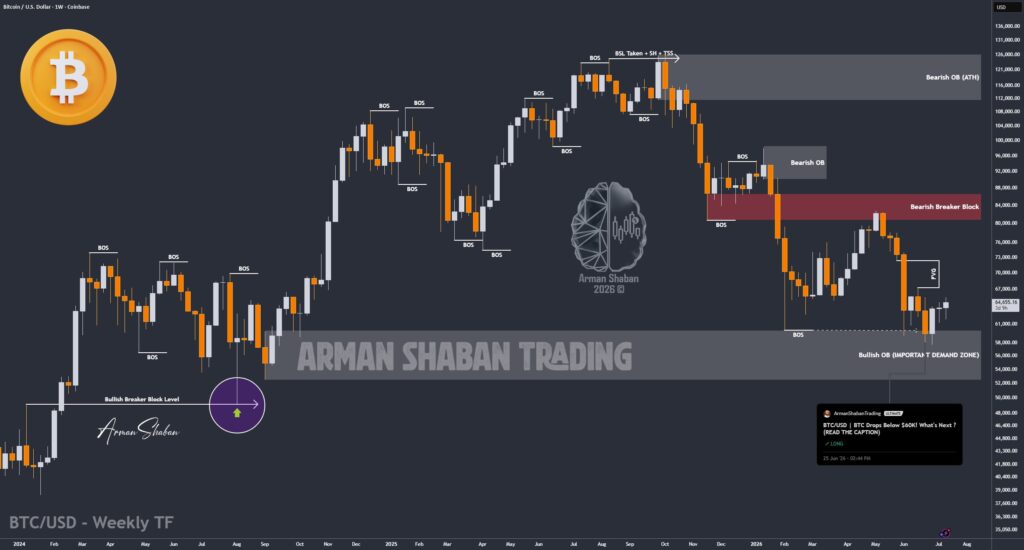
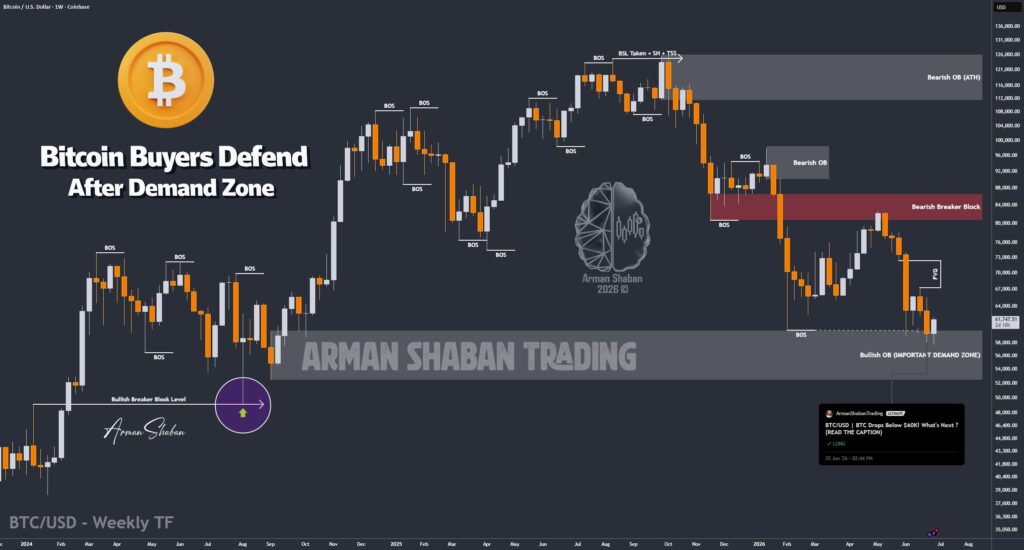
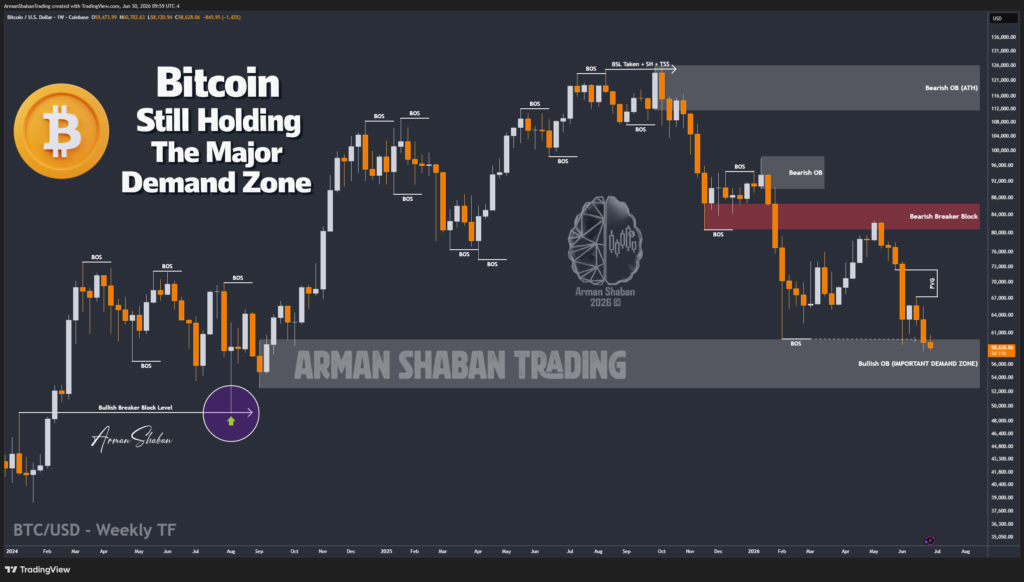
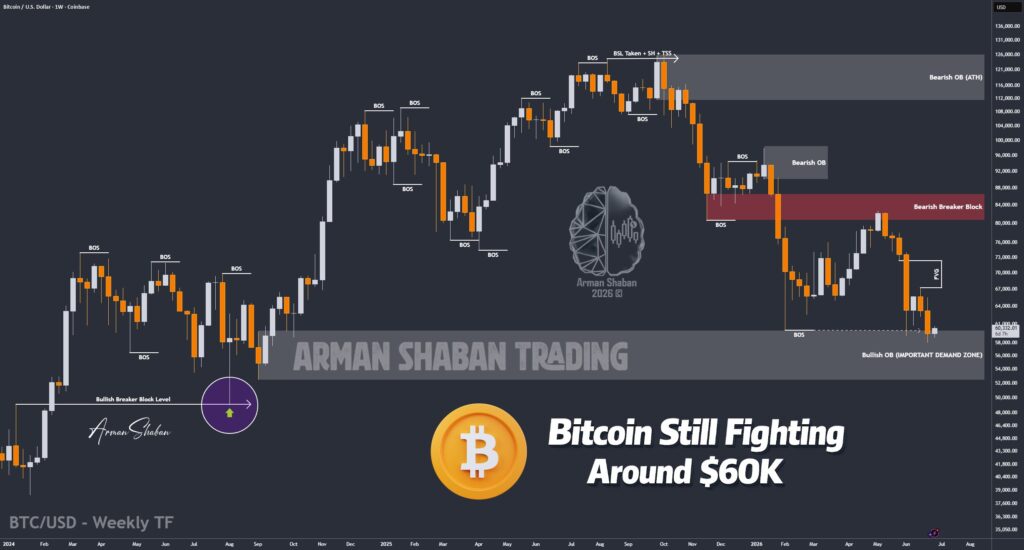
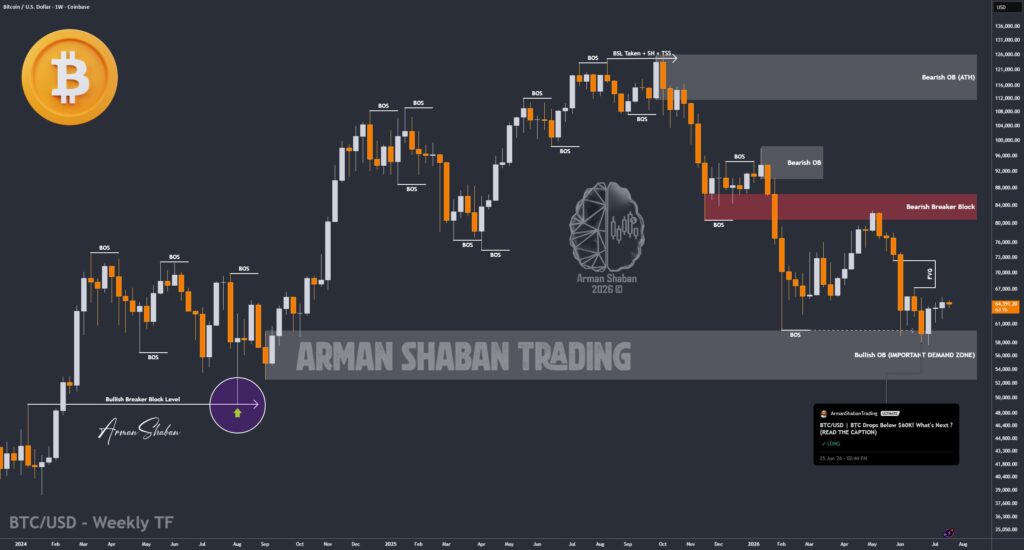
Bitcoin Analysis: By analyzing the #Bitcoin chart on the weekly timeframe, we can see that price continues to show strong retention at higher levels. Over the past few days, Bitcoin was pushed lower several times, but buyers stepped in quickly each time and drove price back up. BTC is currently trading around $64,300, confirming that…
Read more