Bitcoin Analysis – 29.May.2026
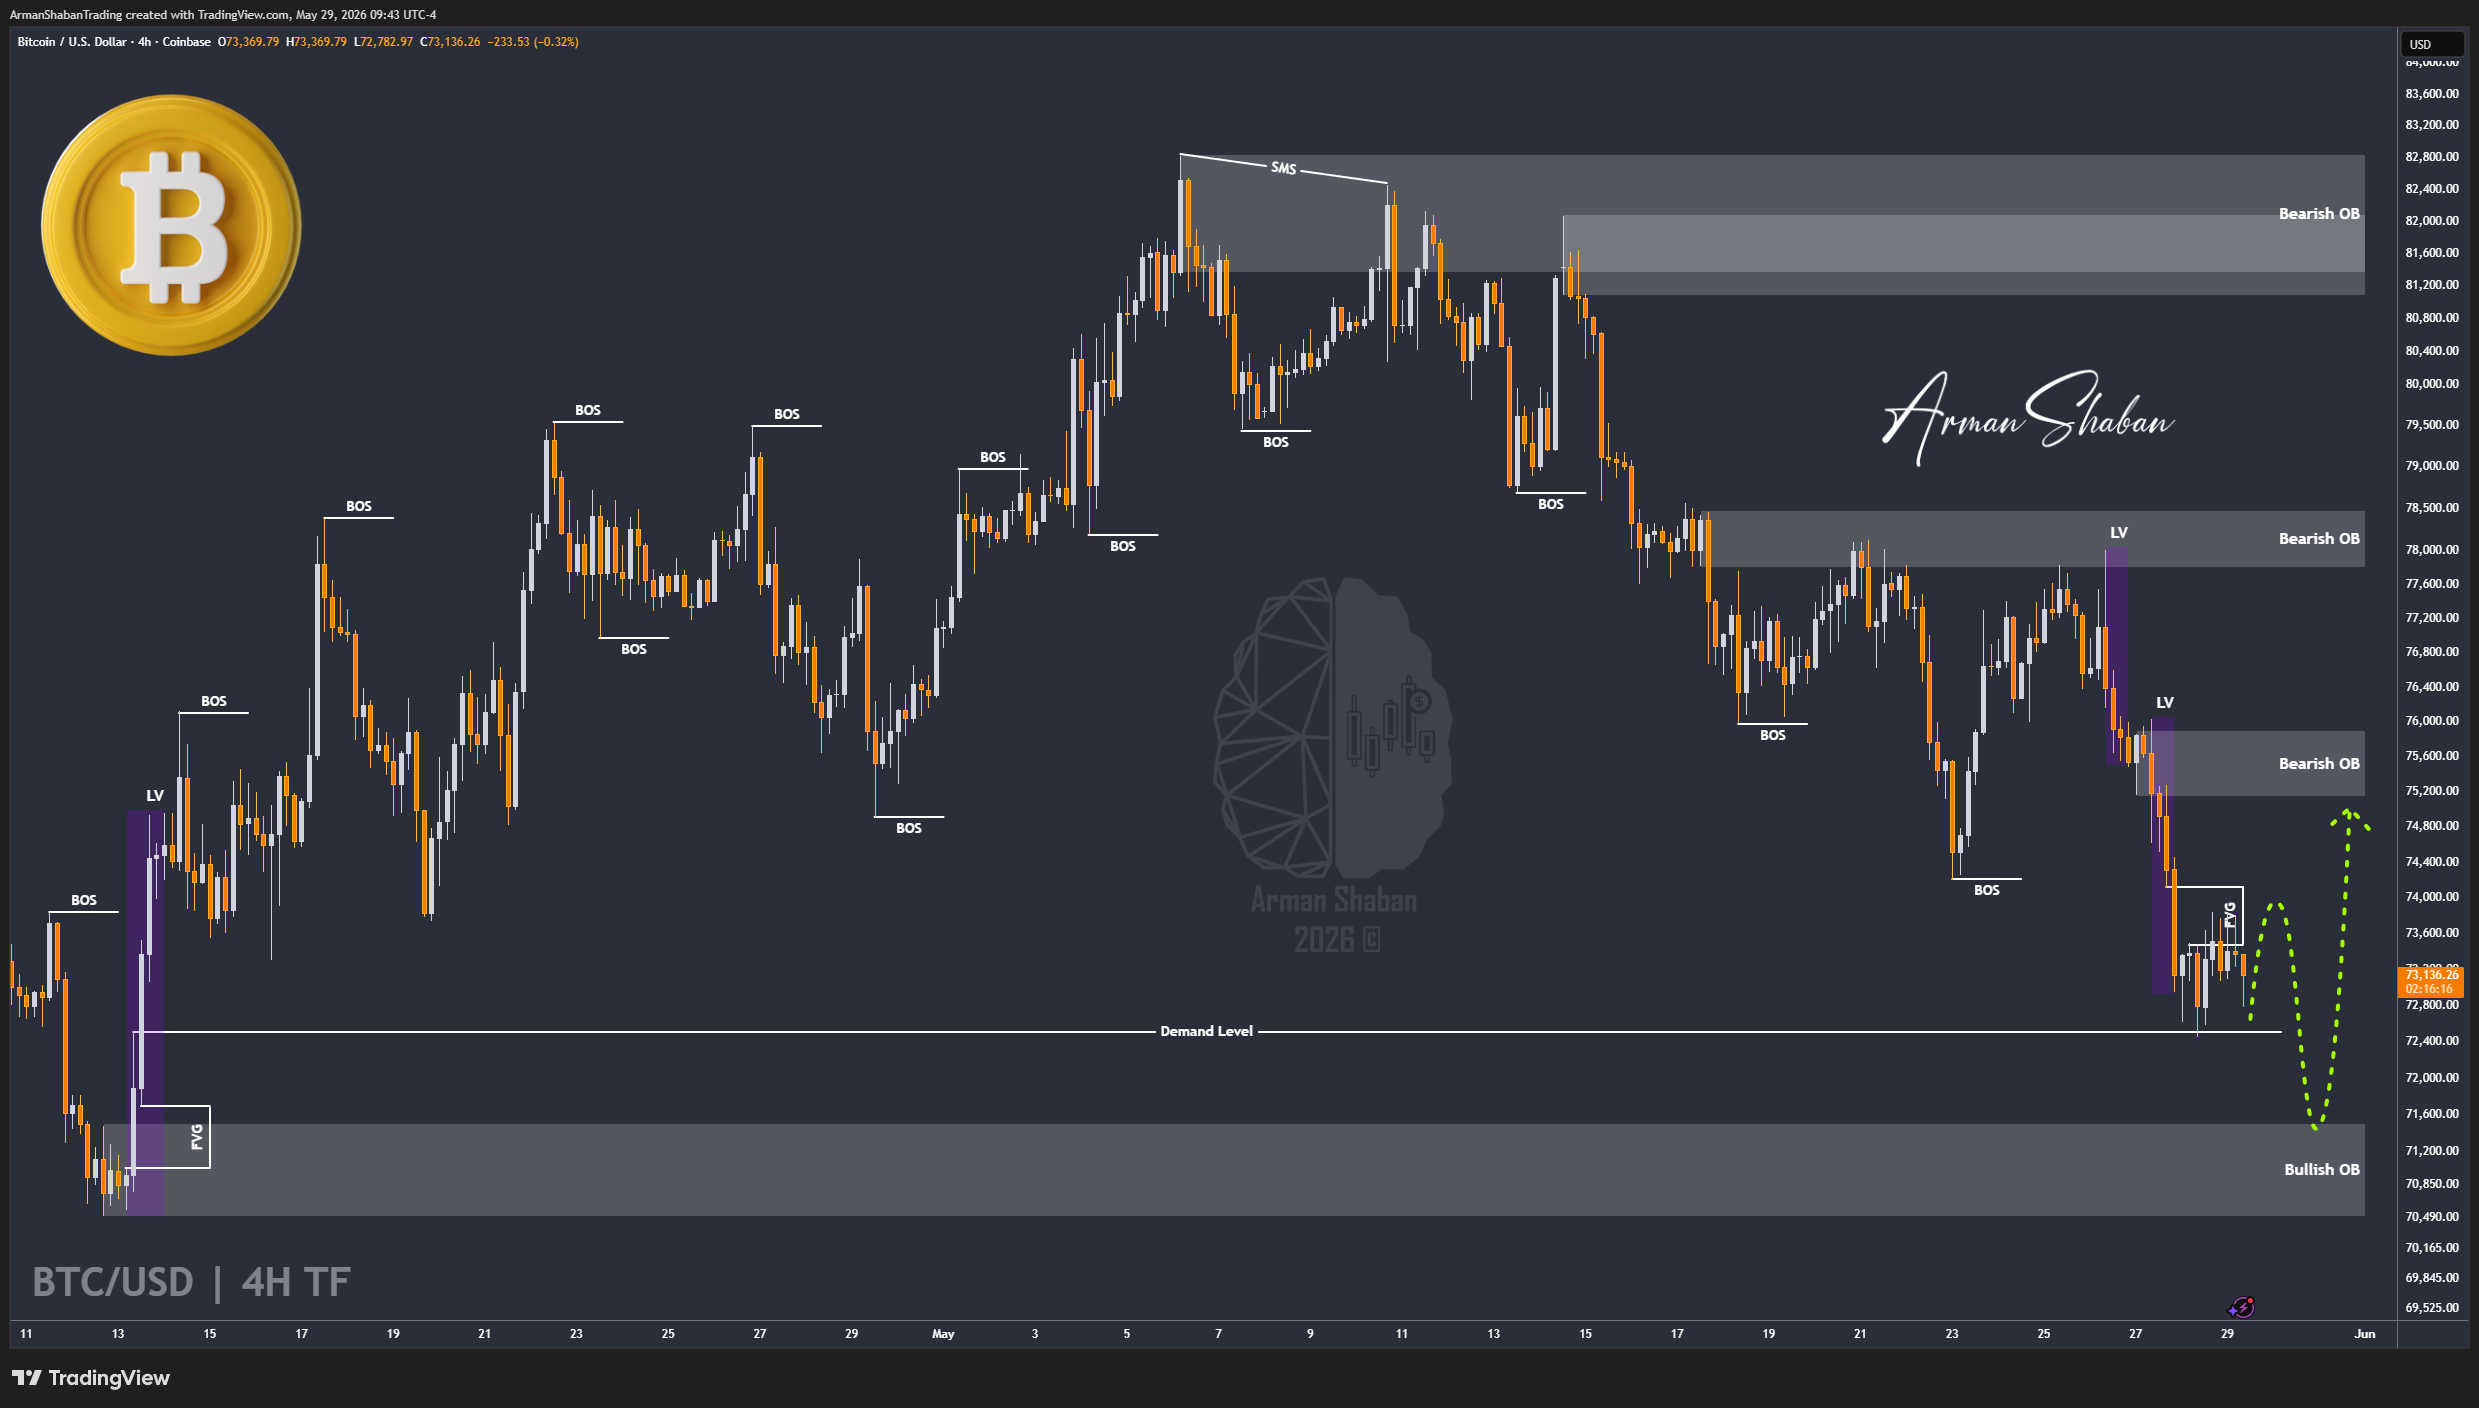
Bitcoin Analysis: By analyzing the #Bitcoin chart on the 4H timeframe, we can see that price followed the expected scenario discussed yesterday. BTC managed to rally toward the $73,880 region and successfully filled more than 50% of the targeted FVG before facing another corrective pullback.
Currently, Bitcoin is trading around the $73K region and the market is approaching a critical decision point. The key question now is whether sellers can push price below the important $72,400 support level or not.
If sellers manage to secure a breakdown below $72,400, the next downside target would be the $71,500 demand zone where deeper liquidity is resting. In my view, that area could become an attractive accumulation zone before the next bullish expansion begins. In that case, the first recovery target would once again be the $75K region.
From a structural perspective, the nearest demand zones are located around $71,500 – $72,400, with deeper support sitting between $69K – $70K. On the upside, the closest supply zones are forming around $74K – $75K, followed by the stronger resistance cluster between $77K – $78K.
For now, the broader structure still looks corrective rather than fully bearish. The reaction around $72,400 will likely determine whether BTC first sweeps lower liquidity or starts the next bullish leg directly.
(This Post on TradingView)
Author : Arman Shaban
To see more analyzes of Gold , Forex Pairs , Cryptocurrencies , Indices and Stocks , be sure to Follow and Join us on other Platforms :
– Public Telegram Channel
– YouTube Channel
– TradingView
– X (Twitter)
– How to join our FOREX VIP Channel ?
– How to join our Crypto VIP Channel ?
– CONTACT ME directly on Telegram

