Bitcoin Analysis – 19.Feb.2026
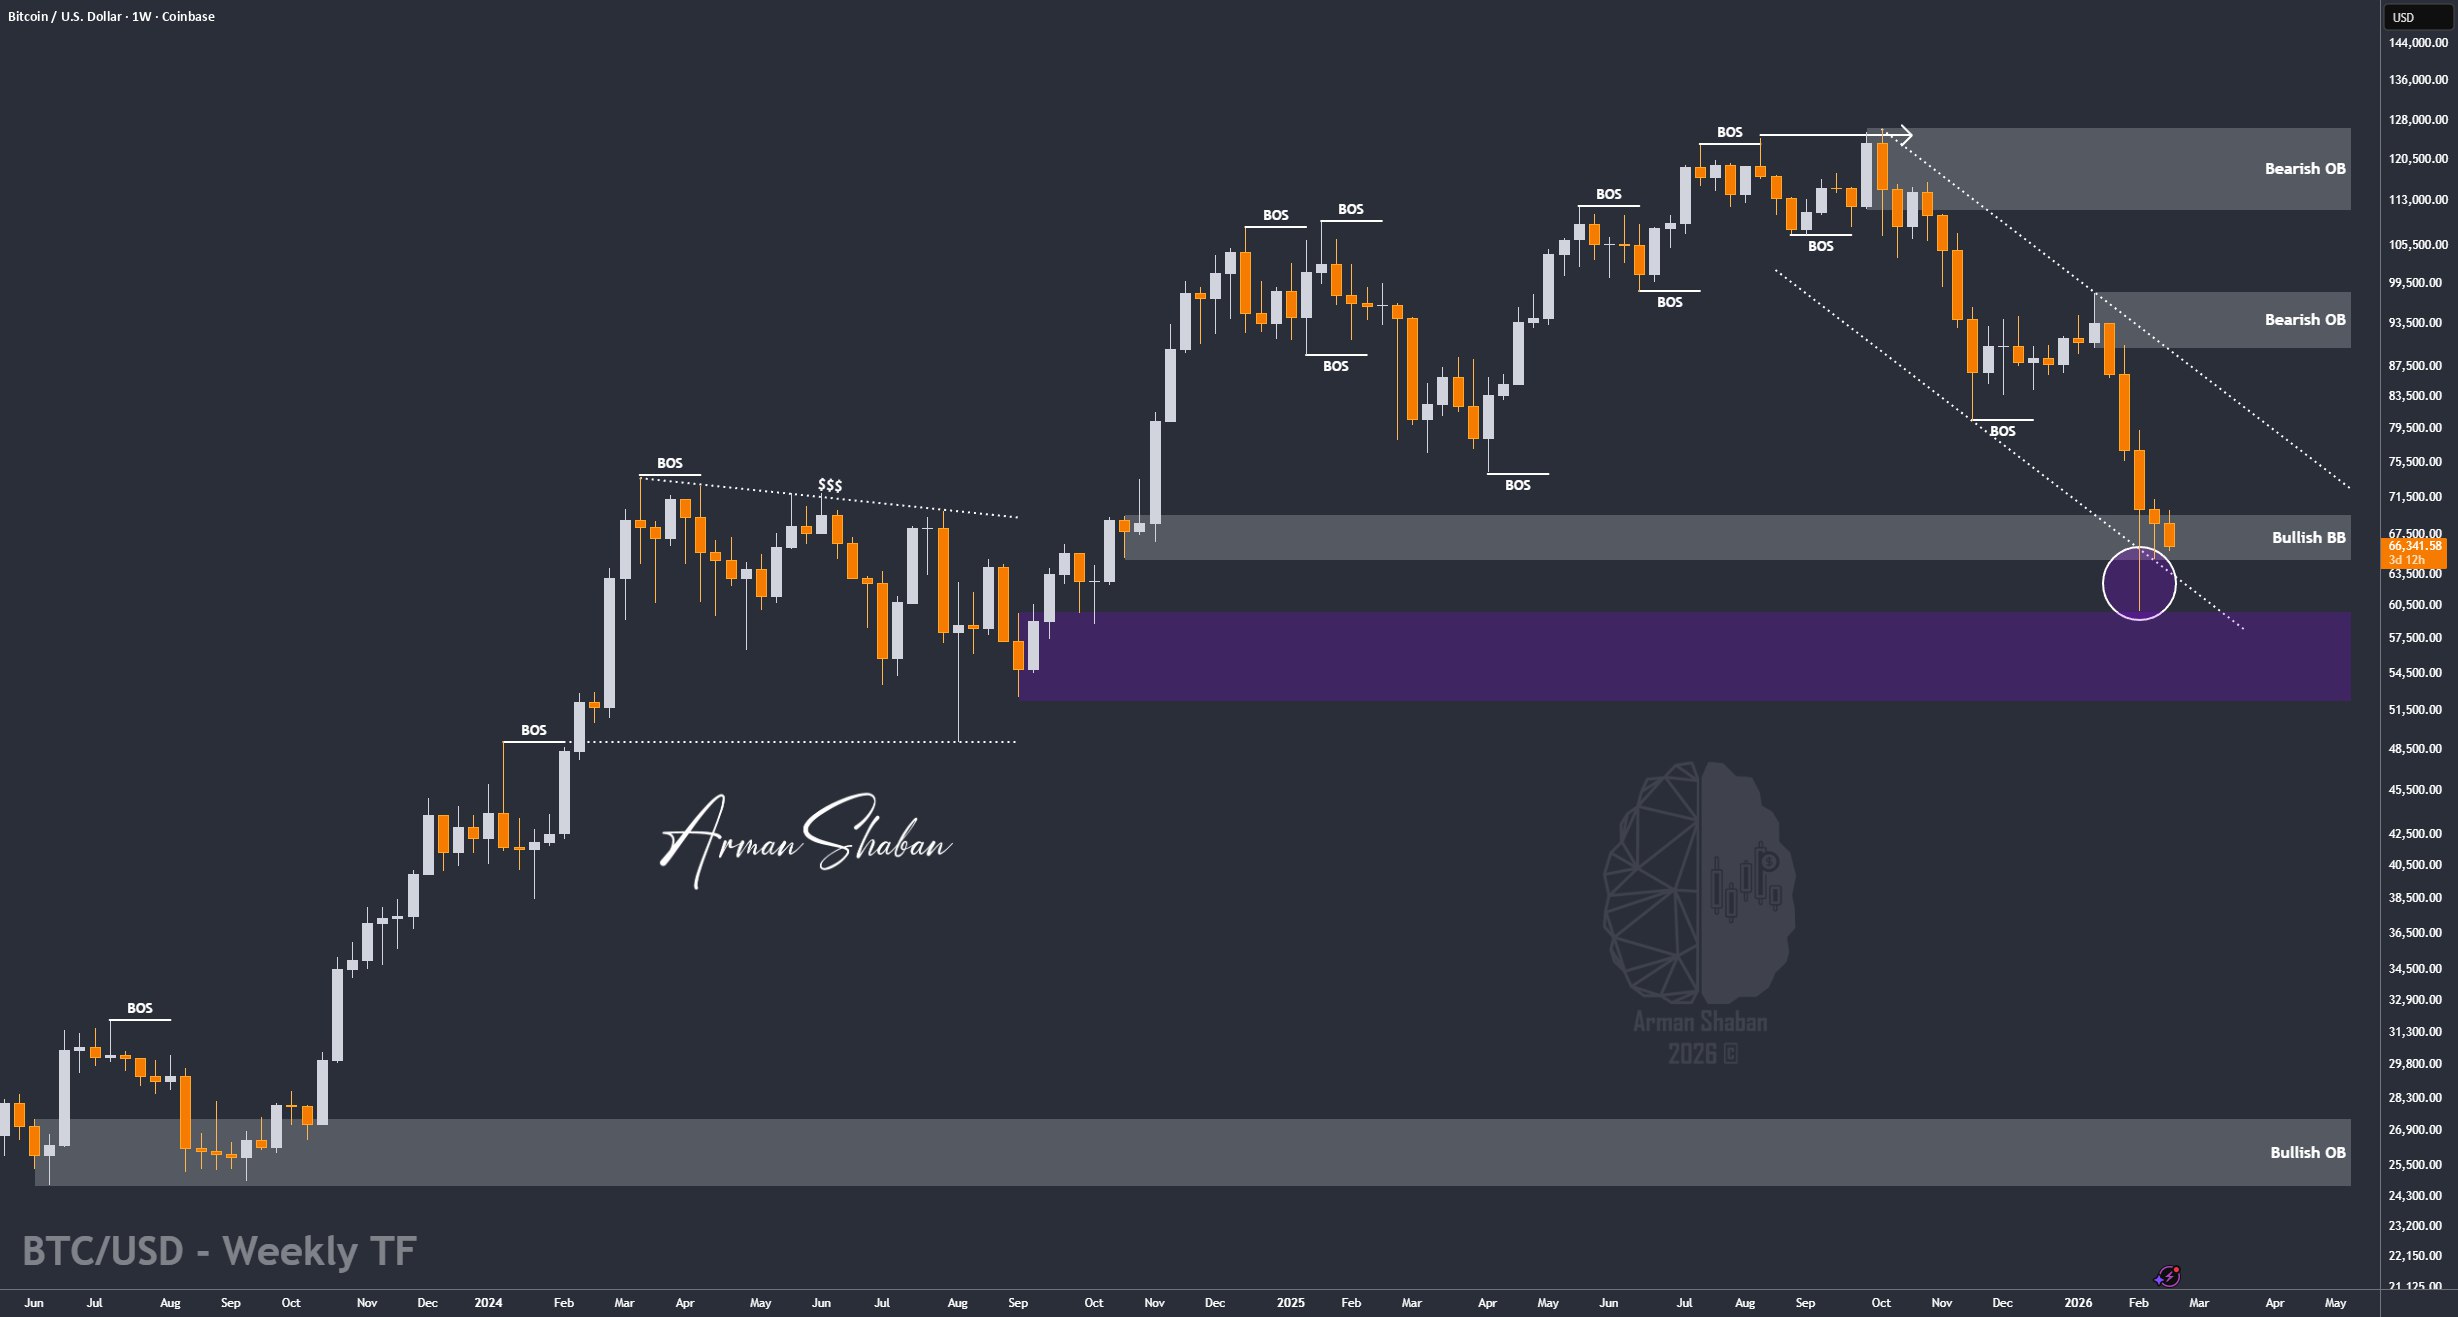
Bitcoin Analysis: By analyzing the #Bitcoin chart on the weekly timeframe, we can see that price is currently trading around the $66,400 level. The $66,000 zone continues to prevent further downside and has now clearly become the key decision point for the next major move in Bitcoin.
All primary structural assumptions remain valid, but this level is now trend-defining. As long as price holds above the $66,000 zone, it remains the first attractive area to monitor for long positioning from a structural perspective.
However, if geopolitical tensions in the Middle East escalate and risk-off sentiment intensifies, we could initially see a sharp downside move toward the $59,000 to $49,000 region. This broader demand zone would represent a highly attractive accumulation area for long-term investors, where a second scaling entry could be strategically considered.
On the other hand, if no major escalation occurs and the $66,000 level continues to hold firmly, the next bullish wave could begin sooner than expected, with upside potential expanding toward the $80,000+ region.
This chart will continue to be updated step by step as price reacts to key levels.
(This Post on TradingView)
Author : Arman Shaban
To see more analyzes of Gold , Forex Pairs , Cryptocurrencies , Indices and Stocks , be sure to Follow and Join us on other Platforms :
– Public Telegram Channel
– YouTube Channel
– TradingView
– X (Twitter)
– How to join our FOREX VIP Channel ?
– How to join our Crypto VIP Channel ?
– CONTACT ME directly on Telegram