Bitcoin Analysis – 18.Nov.2025
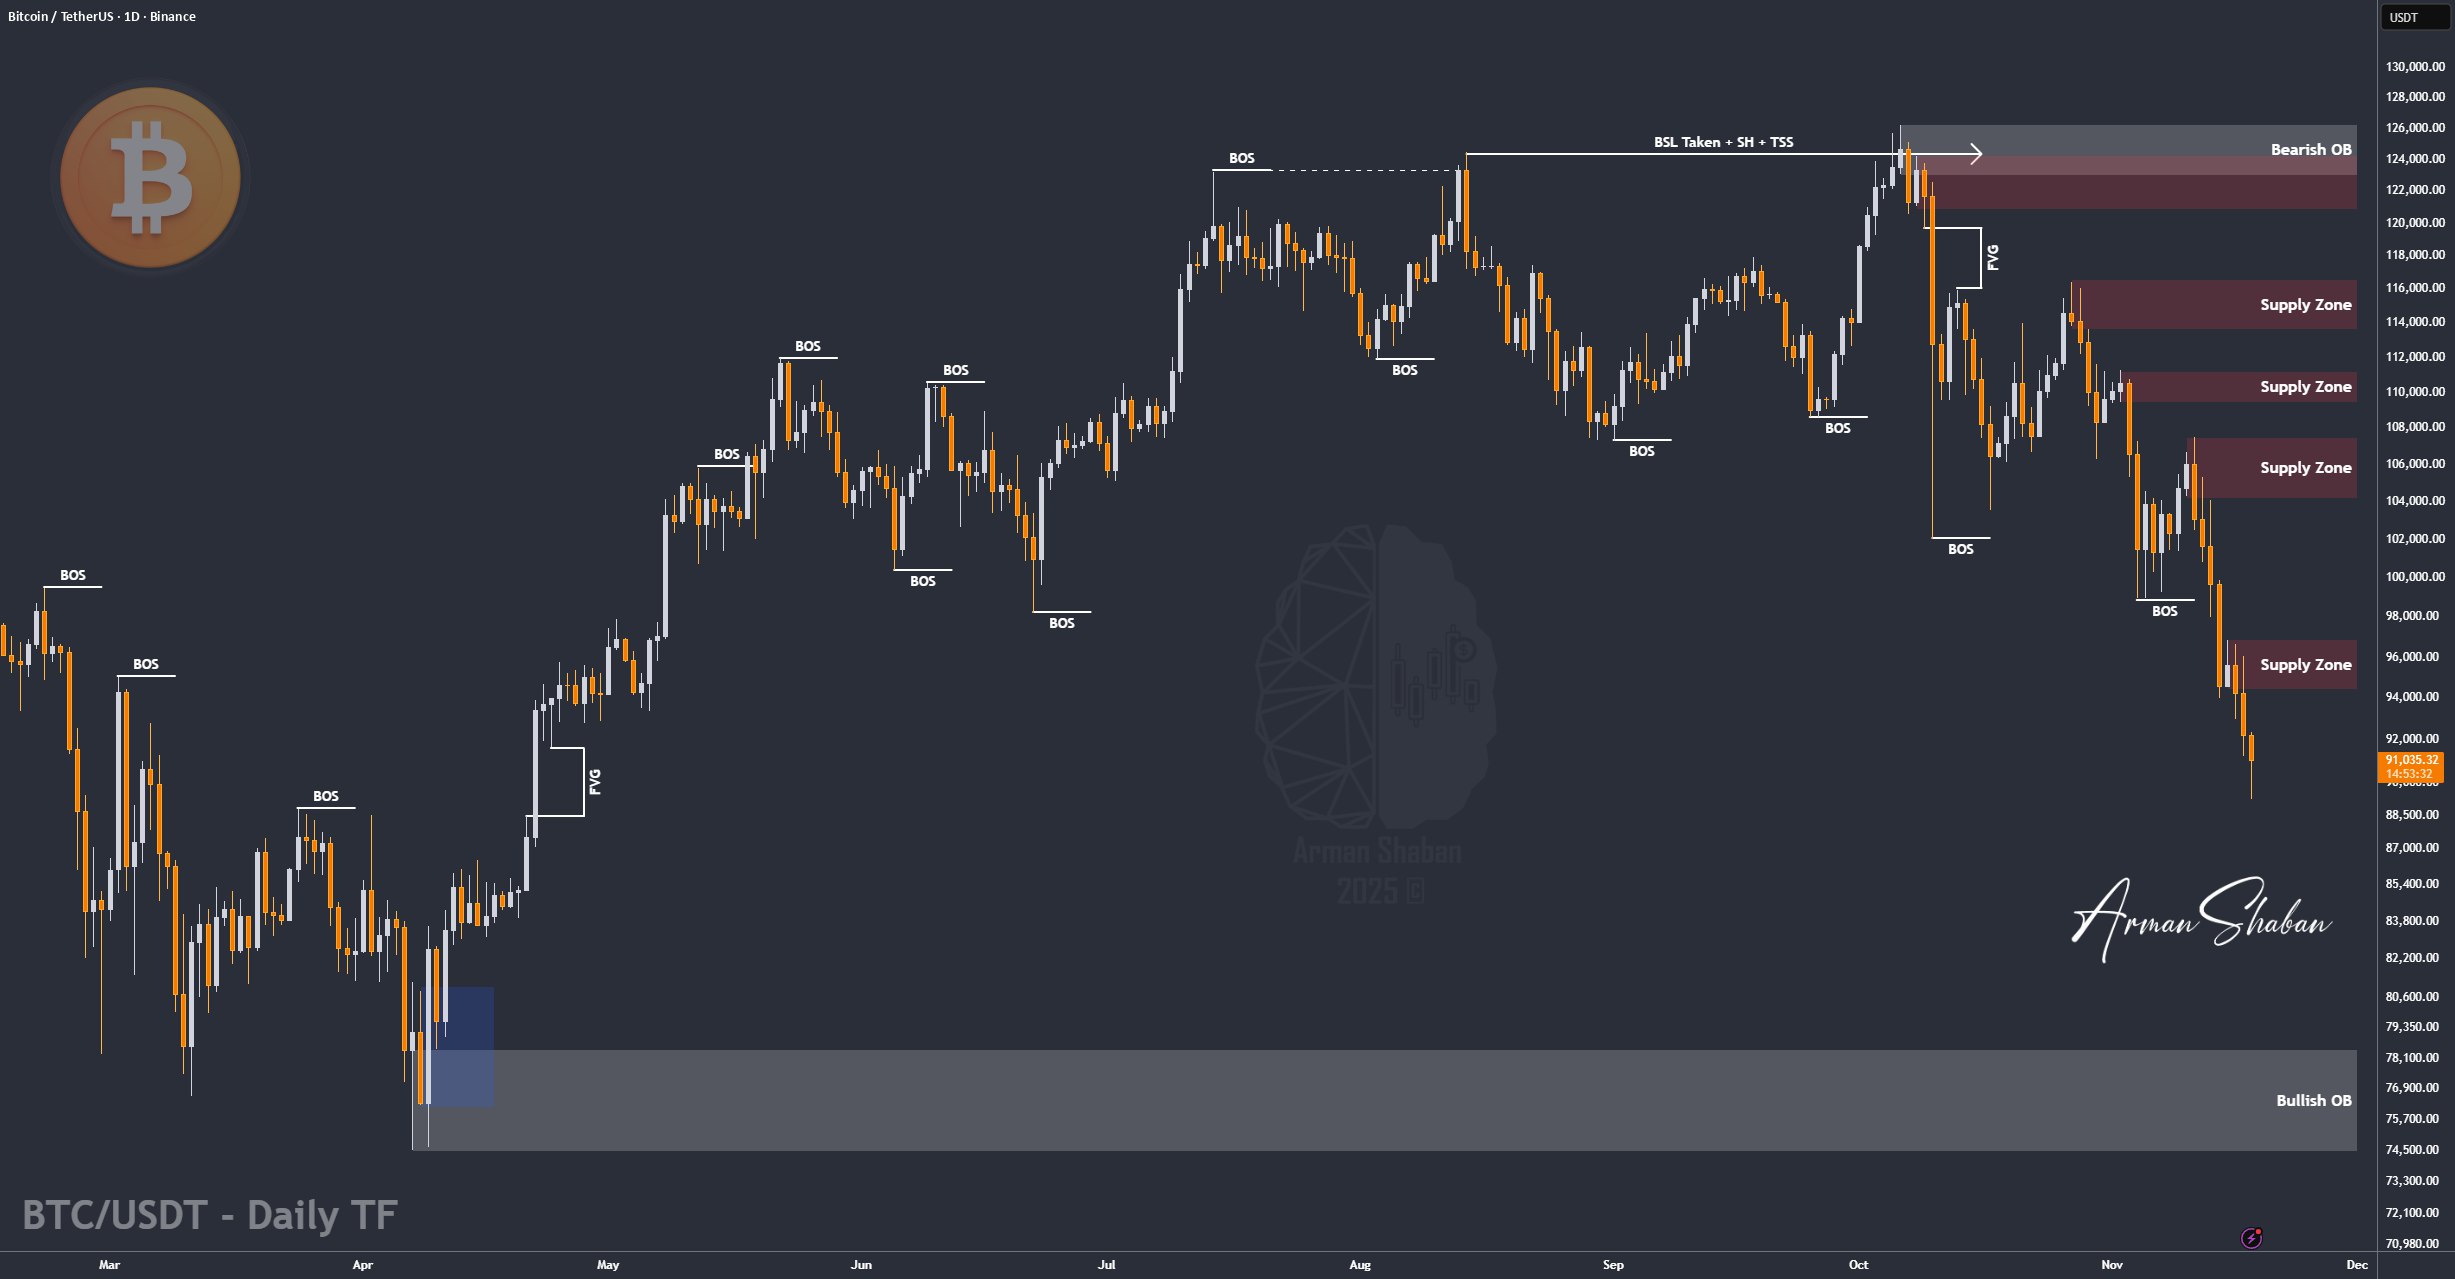
Bitcoin Analysis: By analyzing the #Bitcoin chart on the daily timeframe, we can see that BTC failed to hold above $104,700, and as expected, this led to a heavy sell-off. First, the price dropped to $94,000, and then a second strong wave pushed it down to $89,000. Bitcoin is now trading around $91,000.
Key supply zones and demand zones are marked on the chart. Important demand levels sit at $88,000, $84,000, and the larger zone at $74,000–$78,000. Watch how the price reacts to these areas.
If Bitcoin wants to recover, it must first hold above these key zones. But if BTC breaks below $74,000, it could open the door for a deeper drop toward $50,000. For now, focus on price reactions at the marked demand levels.
(This Post on TradingView)
Author : Arman Shaban
To see more analyzes of Gold , Forex Pairs , Cryptocurrencies , Indices and Stocks , be sure to Follow and Join us on other Platforms :
– Public Telegram Channel
– YouTube Channel
– TradingView
– X (Twitter)
– How to join our FOREX VIP Channel ?
– How to join our Crypto VIP Channel ?
– CONTACT ME directly on Telegram