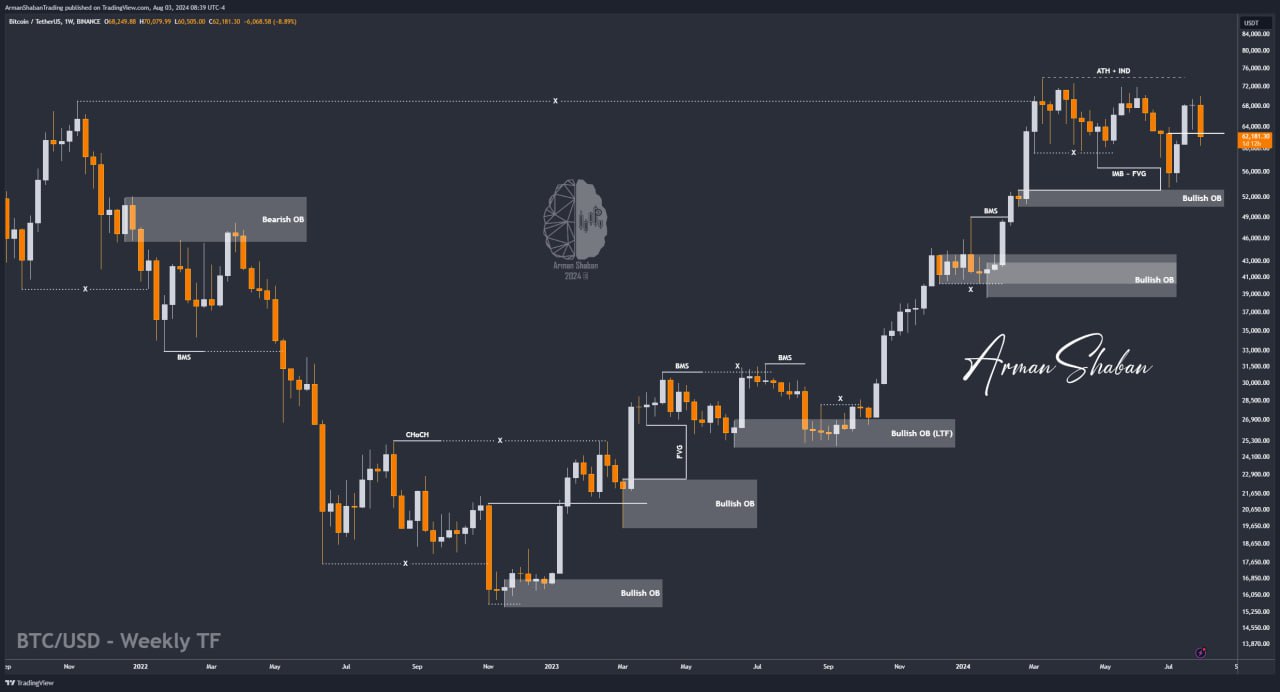
Bitcoin Analysis – 03.Aug.2024

Bitcoin Analysis: By analyzing the #Bitcoin chart on the weekly time frame, we observe that as previously mentioned, the price encountered resistance at the $70,000 level and underwent a correction, dropping to $60,500 until a few hours ago. However, it quickly rebounded due to renewed demand and is currently trading around $62,120. There are two significant zones to watch for a potential reversal: the $60,800 to $62,700 range and the $50,600 to $56,000 range. We need to wait for the weekly candle to close to better predict the next trend. (The risk of war remains high in the market and can significantly impact all markets.)
(This Post on TradingView)
Author : Arman Shaban
To see more analyzes of Gold , Forex Pairs , Cryptocurrencies , Indices and Stocks , be sure to Follow and Join us on other Platforms :
– Public Telegram Channel
– YouTube Channel
– TradingView
– X (Twitter)
– How to join our FOREX VIP Channel ?
– How to join our Crypto VIP Channel ?
– CONTACT ME directly on Telegram