Gold Analysis – 13.Oct.2026
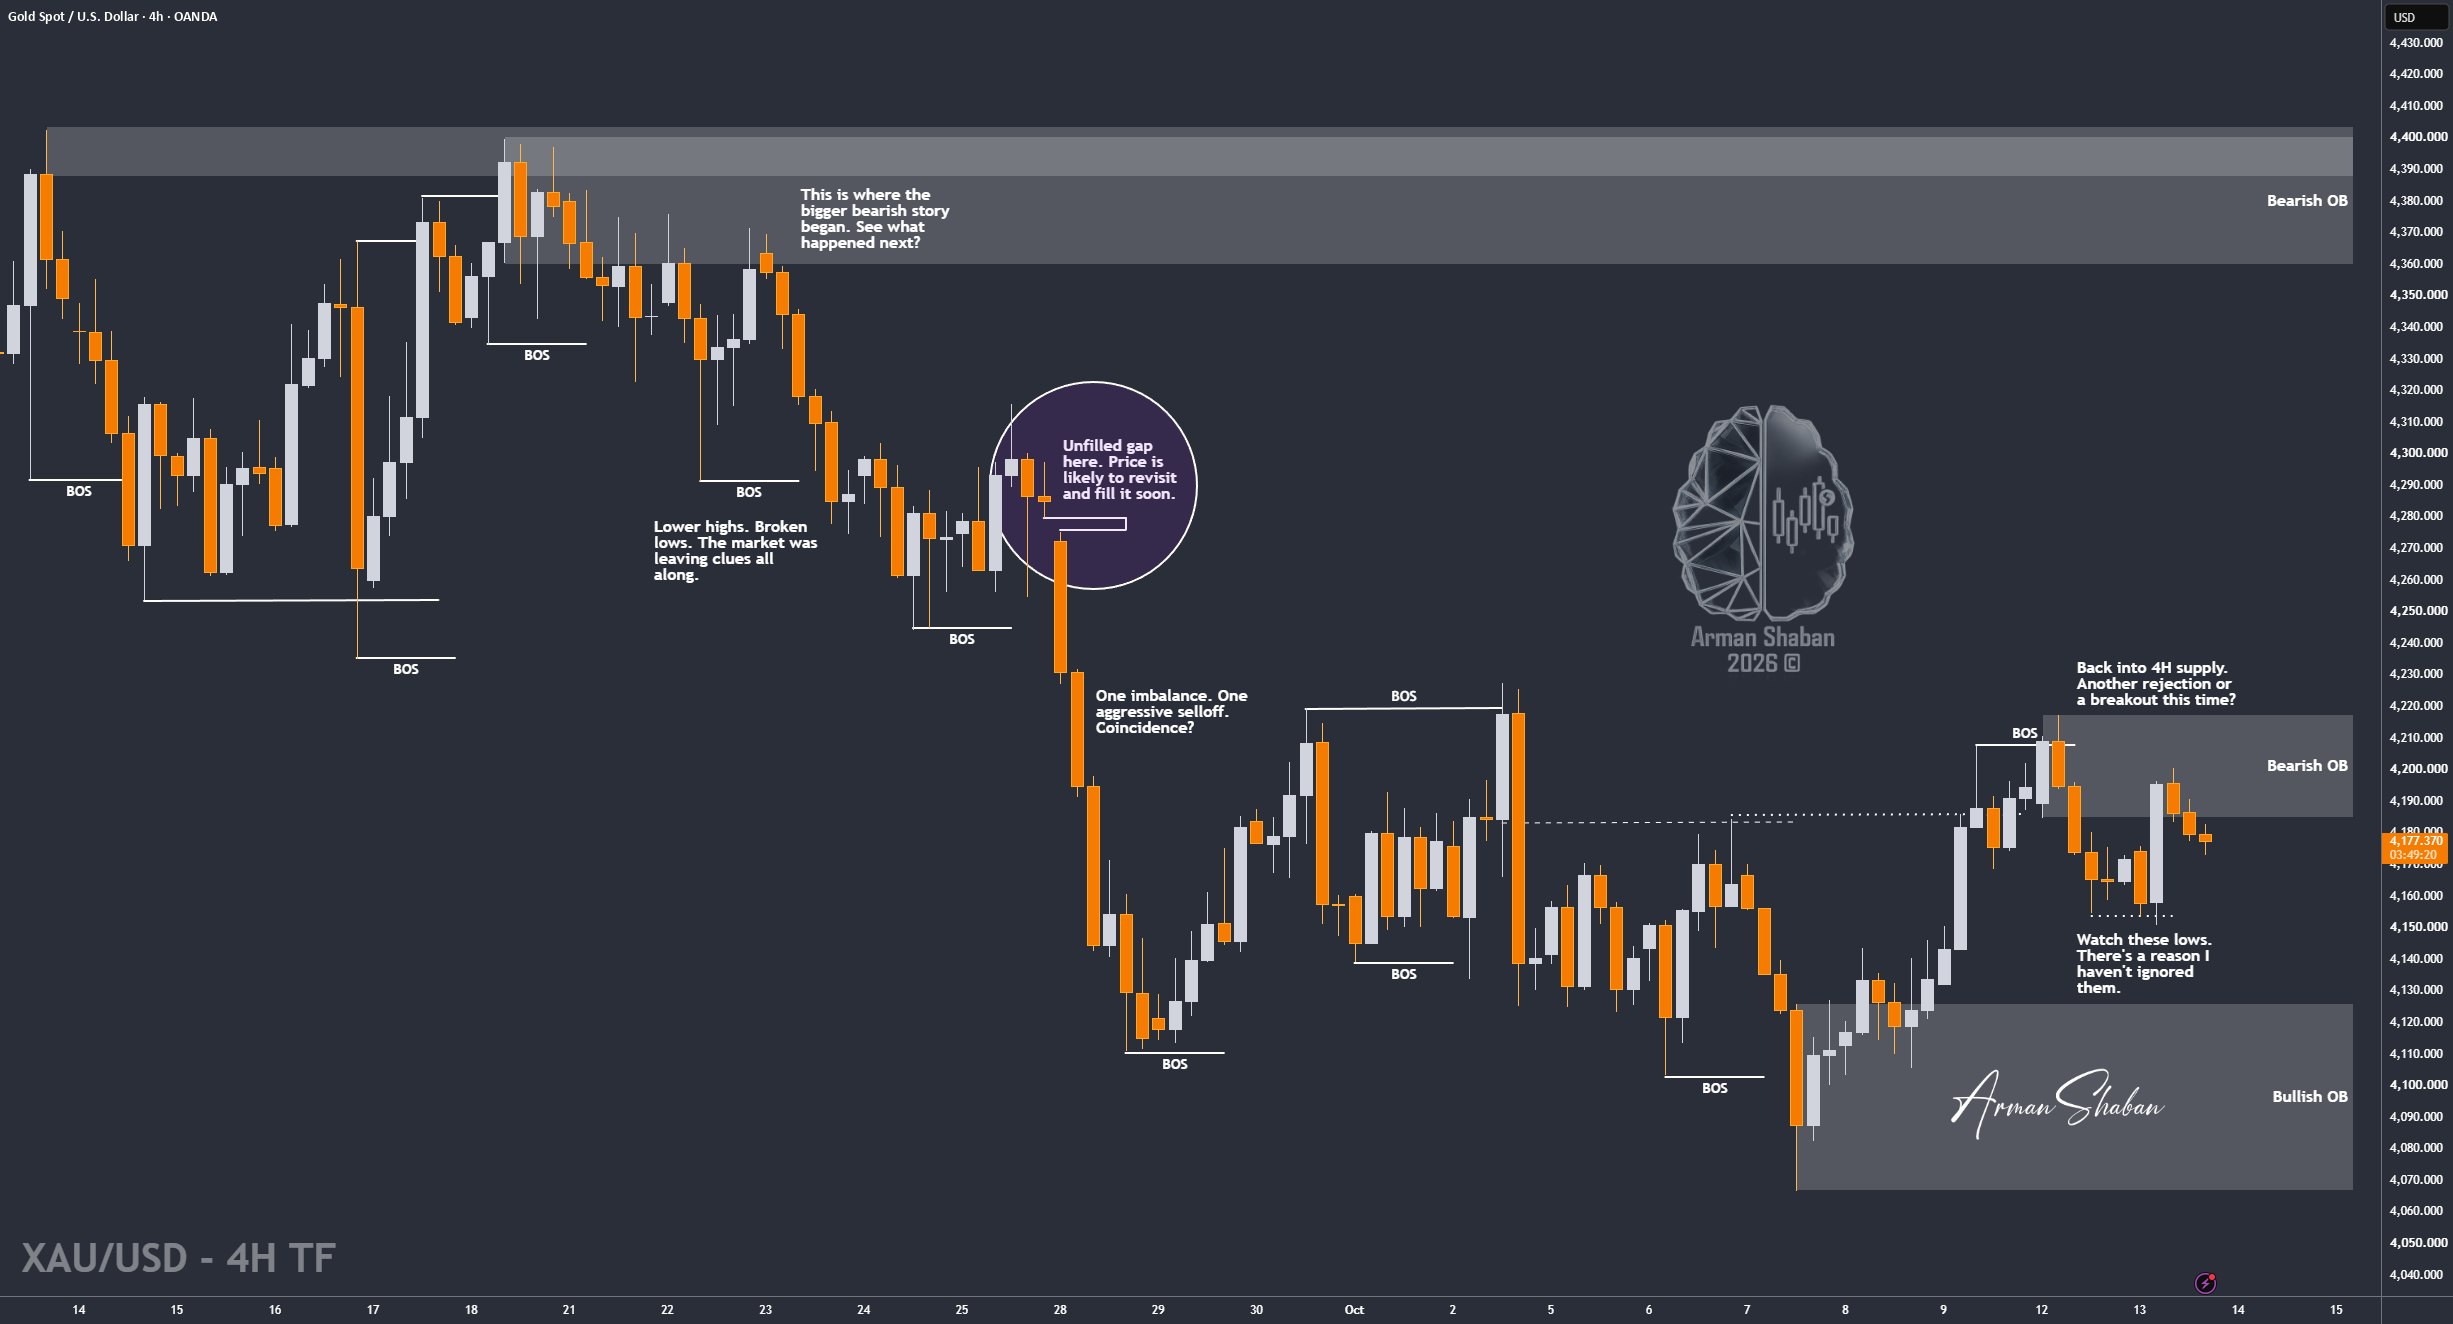
Gold Analysis: Before anything else, this is a completely new Gold analysis, so make sure you open the chart in full quality and carefully study all the important levels I’ve marked!
By analyzing the #Gold chart on the 4H timeframe, we can see that after dropping toward $4066, Gold started a strong recovery toward $4217. Price then corrected to $4150 before buyers stepped in again, filling the liquidity void and pushing Gold back toward $4200.
However, sellers reacted from the important Bearish Order Block, and Gold continued correcting all the way toward $4172, where it is currently trading.
In my view, the $4150 – $4175 demand zone is now extremely important. Gold is already testing this area, and I expect buyers could react positively from here. If price reclaims $4175 and buying pressure increases, the next upside targets I’m watching are $4200, $4217 and potentially $4227.
The $4227 – $4235 area remains a major supply zone, and I expect a possible bearish reaction once Gold reaches it. However, if buyers fail to defend the current demand zone and price stabilizes below $4150, the bullish scenario would weaken significantly.
For now, I’m still looking for a bullish reaction from the current demand area, but confirmation is important. These levels create a very interesting trading roadmap, so study the chart carefully before making your next move!
(This Post on TradingView)
Author : Arman Shaban
To see more analyzes of Gold , Forex Pairs , Cryptocurrencies , Indices and Stocks , be sure to Follow and Join us on other Platforms :
– Public Telegram Channel
– YouTube Channel
– TradingView
– X (Twitter)
– How to join our FOREX VIP Channel ?
– How to join our Crypto VIP Channel ?
– CONTACT ME directly on Telegram

