Gold Analysis – 23.Jul.2026
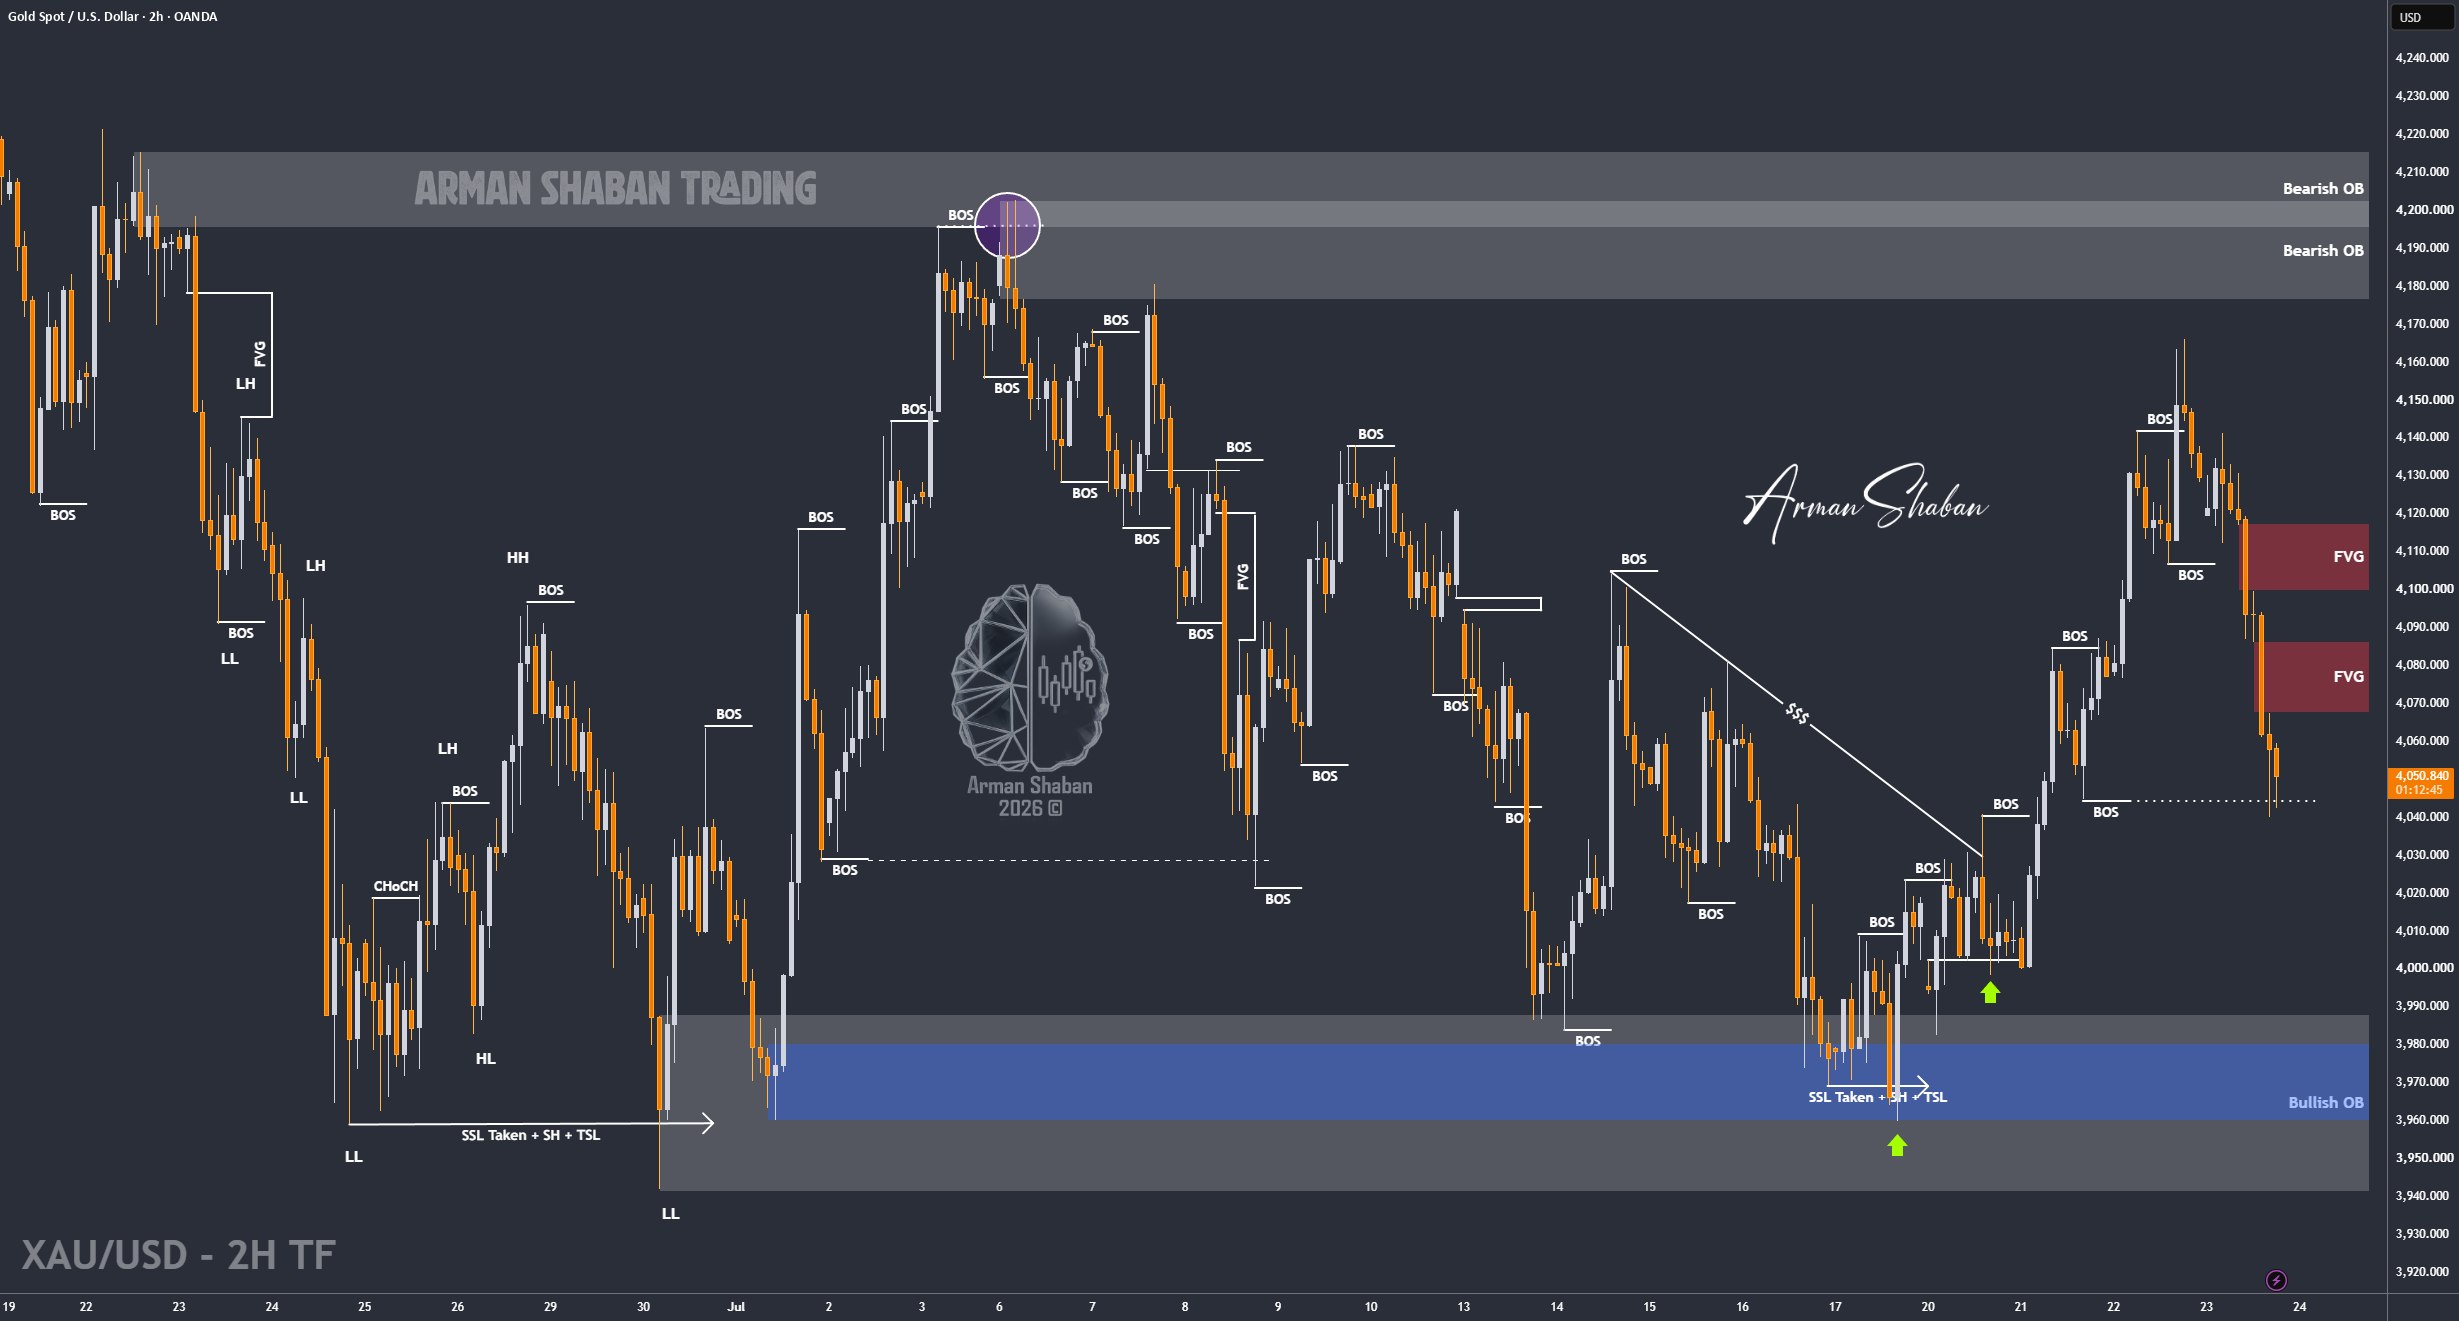
Gold Analysis: By analyzing the #Gold chart on the 2H timeframe, we can see that after reaching the $4166 region, price finally entered the supply area where sellers became active.
Gold then faced heavy selling pressure and dropped sharply toward $4040. Currently, price is trading around $4049.
Considering the continued strength in Oil, I still believe Gold could extend its decline below the psychological $4000 level. However, this bearish scenario needs confirmation.
For the next bearish move to become valid, Gold must break below $4040 and close a 2H candle under this level. If that happens, the next downside targets to monitor are $4020, followed by $4000, $3980, and potentially $3960.
Until this confirmation appears, the reaction around $4040 remains the most important thing to watch.
(This Post on TradingView)
Author : Arman Shaban
To see more analyzes of Gold , Forex Pairs , Cryptocurrencies , Indices and Stocks , be sure to Follow and Join us on other Platforms :
– Public Telegram Channel
– YouTube Channel
– TradingView
– X (Twitter)
– How to join our FOREX VIP Channel ?
– How to join our Crypto VIP Channel ?
– CONTACT ME directly on Telegram

