Bitcoin Analysis – 3.Jul.2026
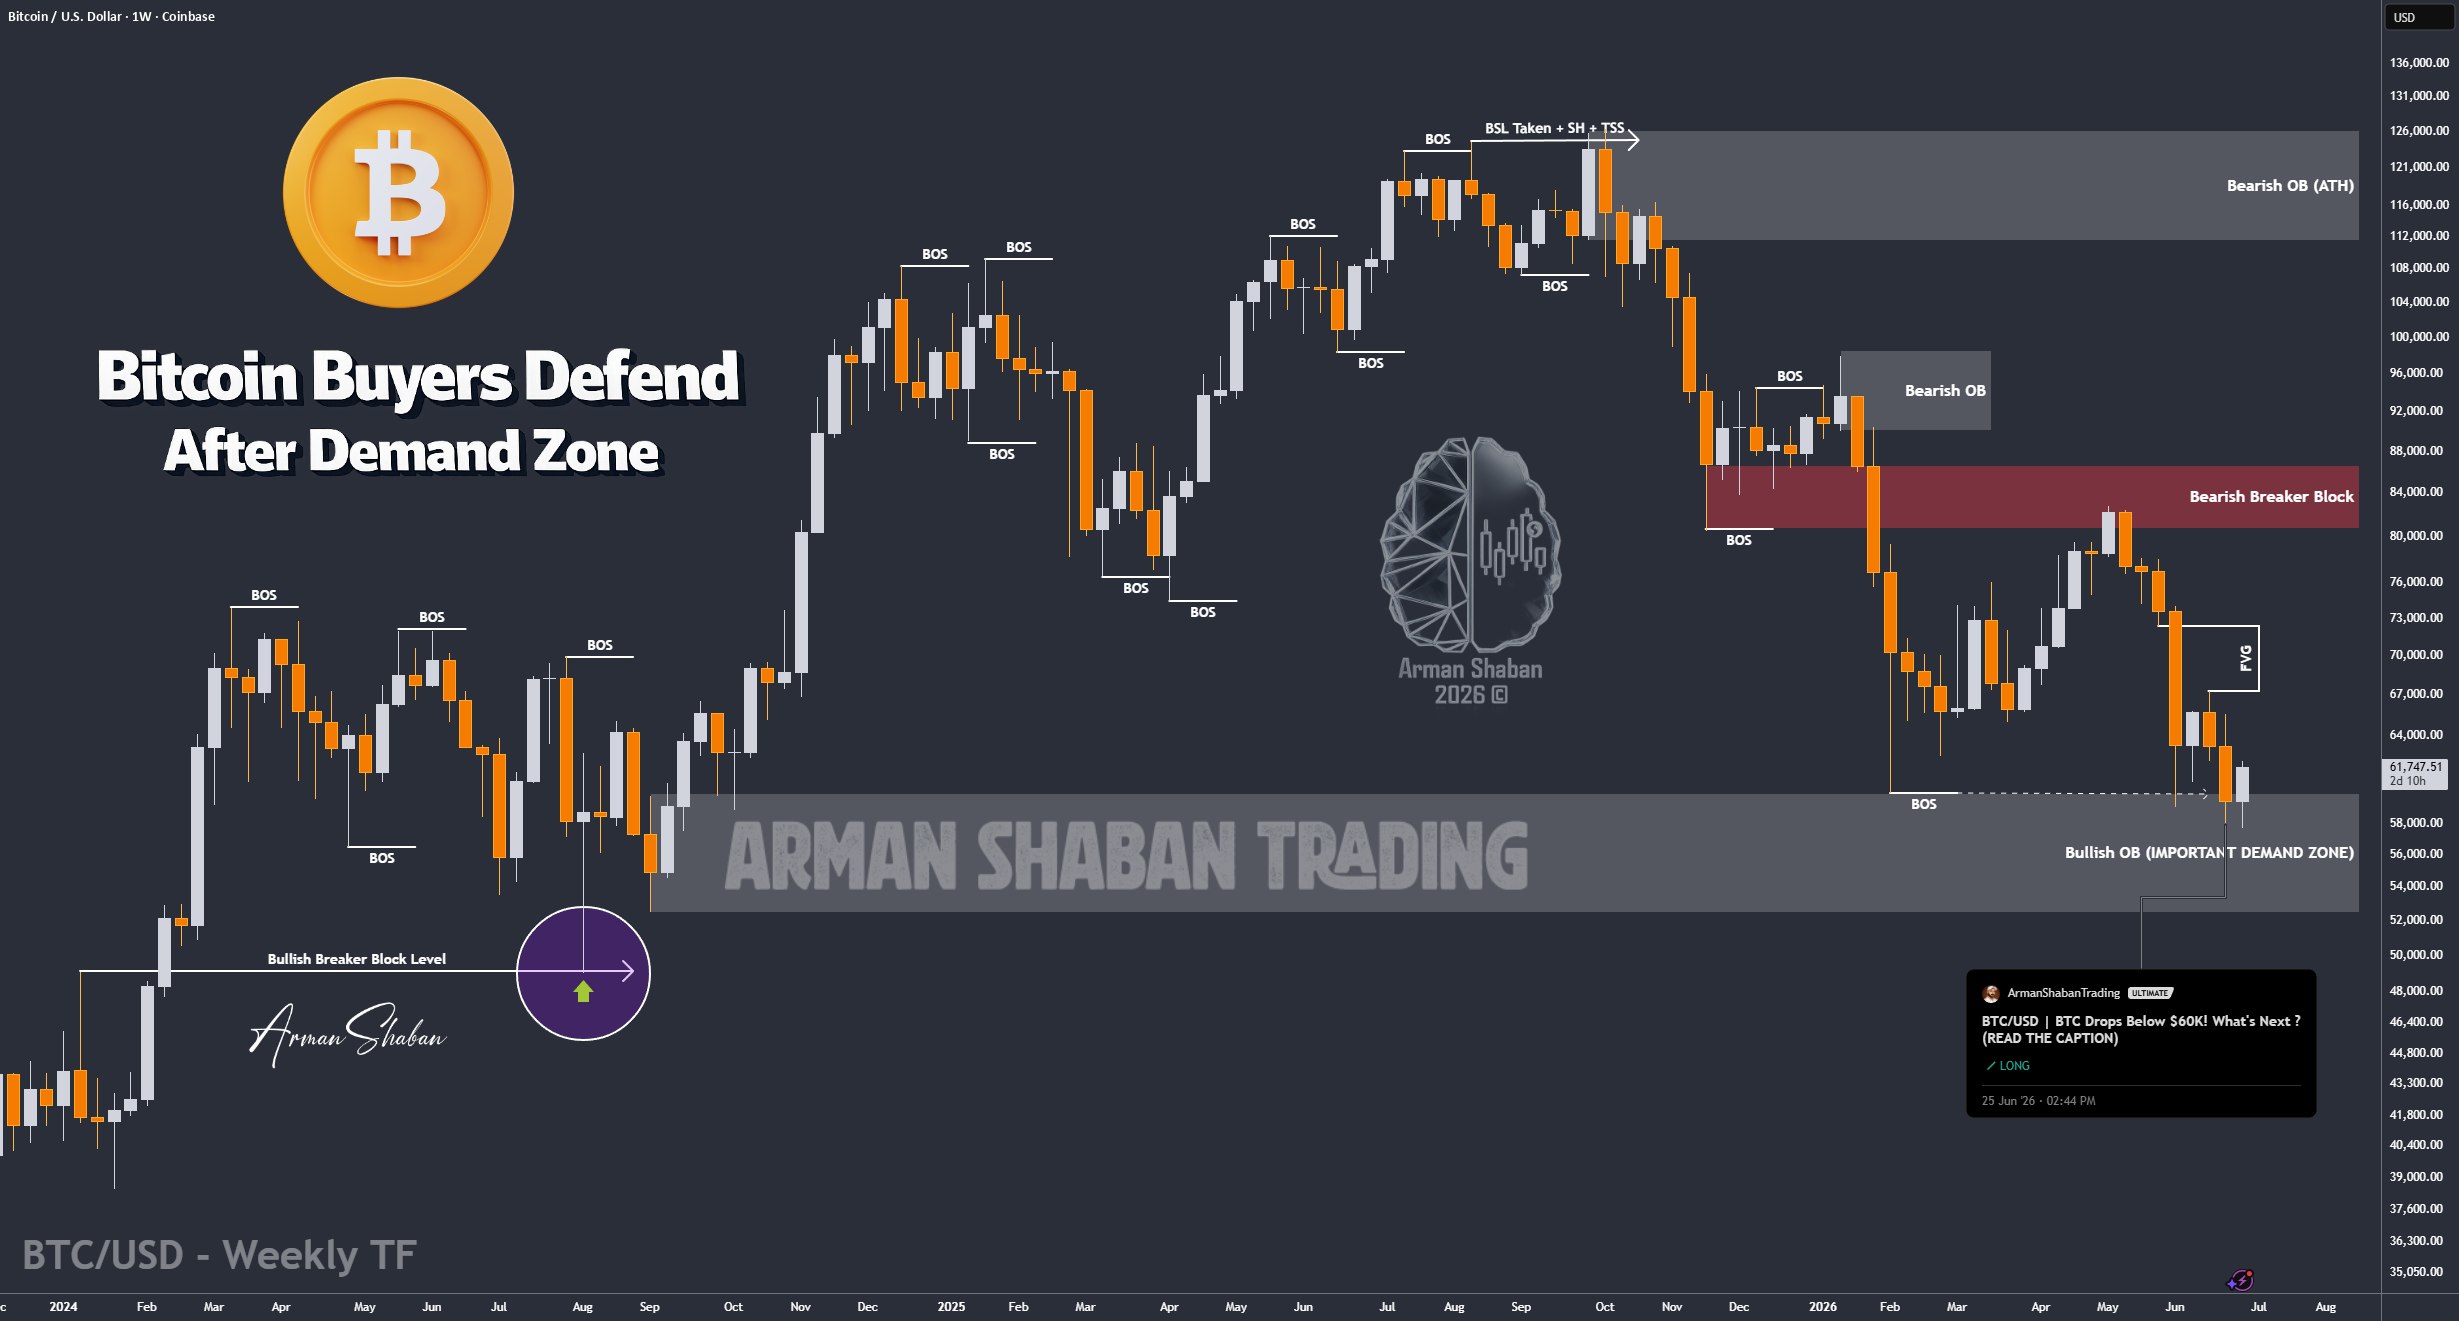
Bitcoin Analysis: By analyzing the #Bitcoin chart on the weekly timeframe, we can see that the demand zone we highlighted in the previous analysis reacted exactly as expected. Buyers stepped in from this area and pushed BTC higher, reaching around the $62,200 region. Currently, Bitcoin is trading around $61,600, and the key level to watch now is $62,300. In my view, if the weekly candle manages to close and stabilize above this level, it could become a very important confirmation for the next bullish move.
The nearest demand zones are still located around $58,000 – $60,000, followed by the deeper liquidity zone between $52,500 – $56,000. On the upside, the closest supply zones are around $63,000 – $66,000, followed by $70,000 – $74,000. If buyers manage to reclaim $62,300, the next upside targets to monitor are $63,000, followed by $66,000, then $70,000, and potentially $74,000 if momentum continues. For now, the reaction from the demand zone was strong, but the weekly close above $62,300 is the real confirmation we need to see.
(This Post on TradingView)
Author : Arman Shaban
To see more analyzes of Gold , Forex Pairs , Cryptocurrencies , Indices and Stocks , be sure to Follow and Join us on other Platforms :
– Public Telegram Channel
– YouTube Channel
– TradingView
– X (Twitter)
– How to join our FOREX VIP Channel ?
– How to join our Crypto VIP Channel ?
– CONTACT ME directly on Telegram