USD/JPY Analysis – 29.May.2026
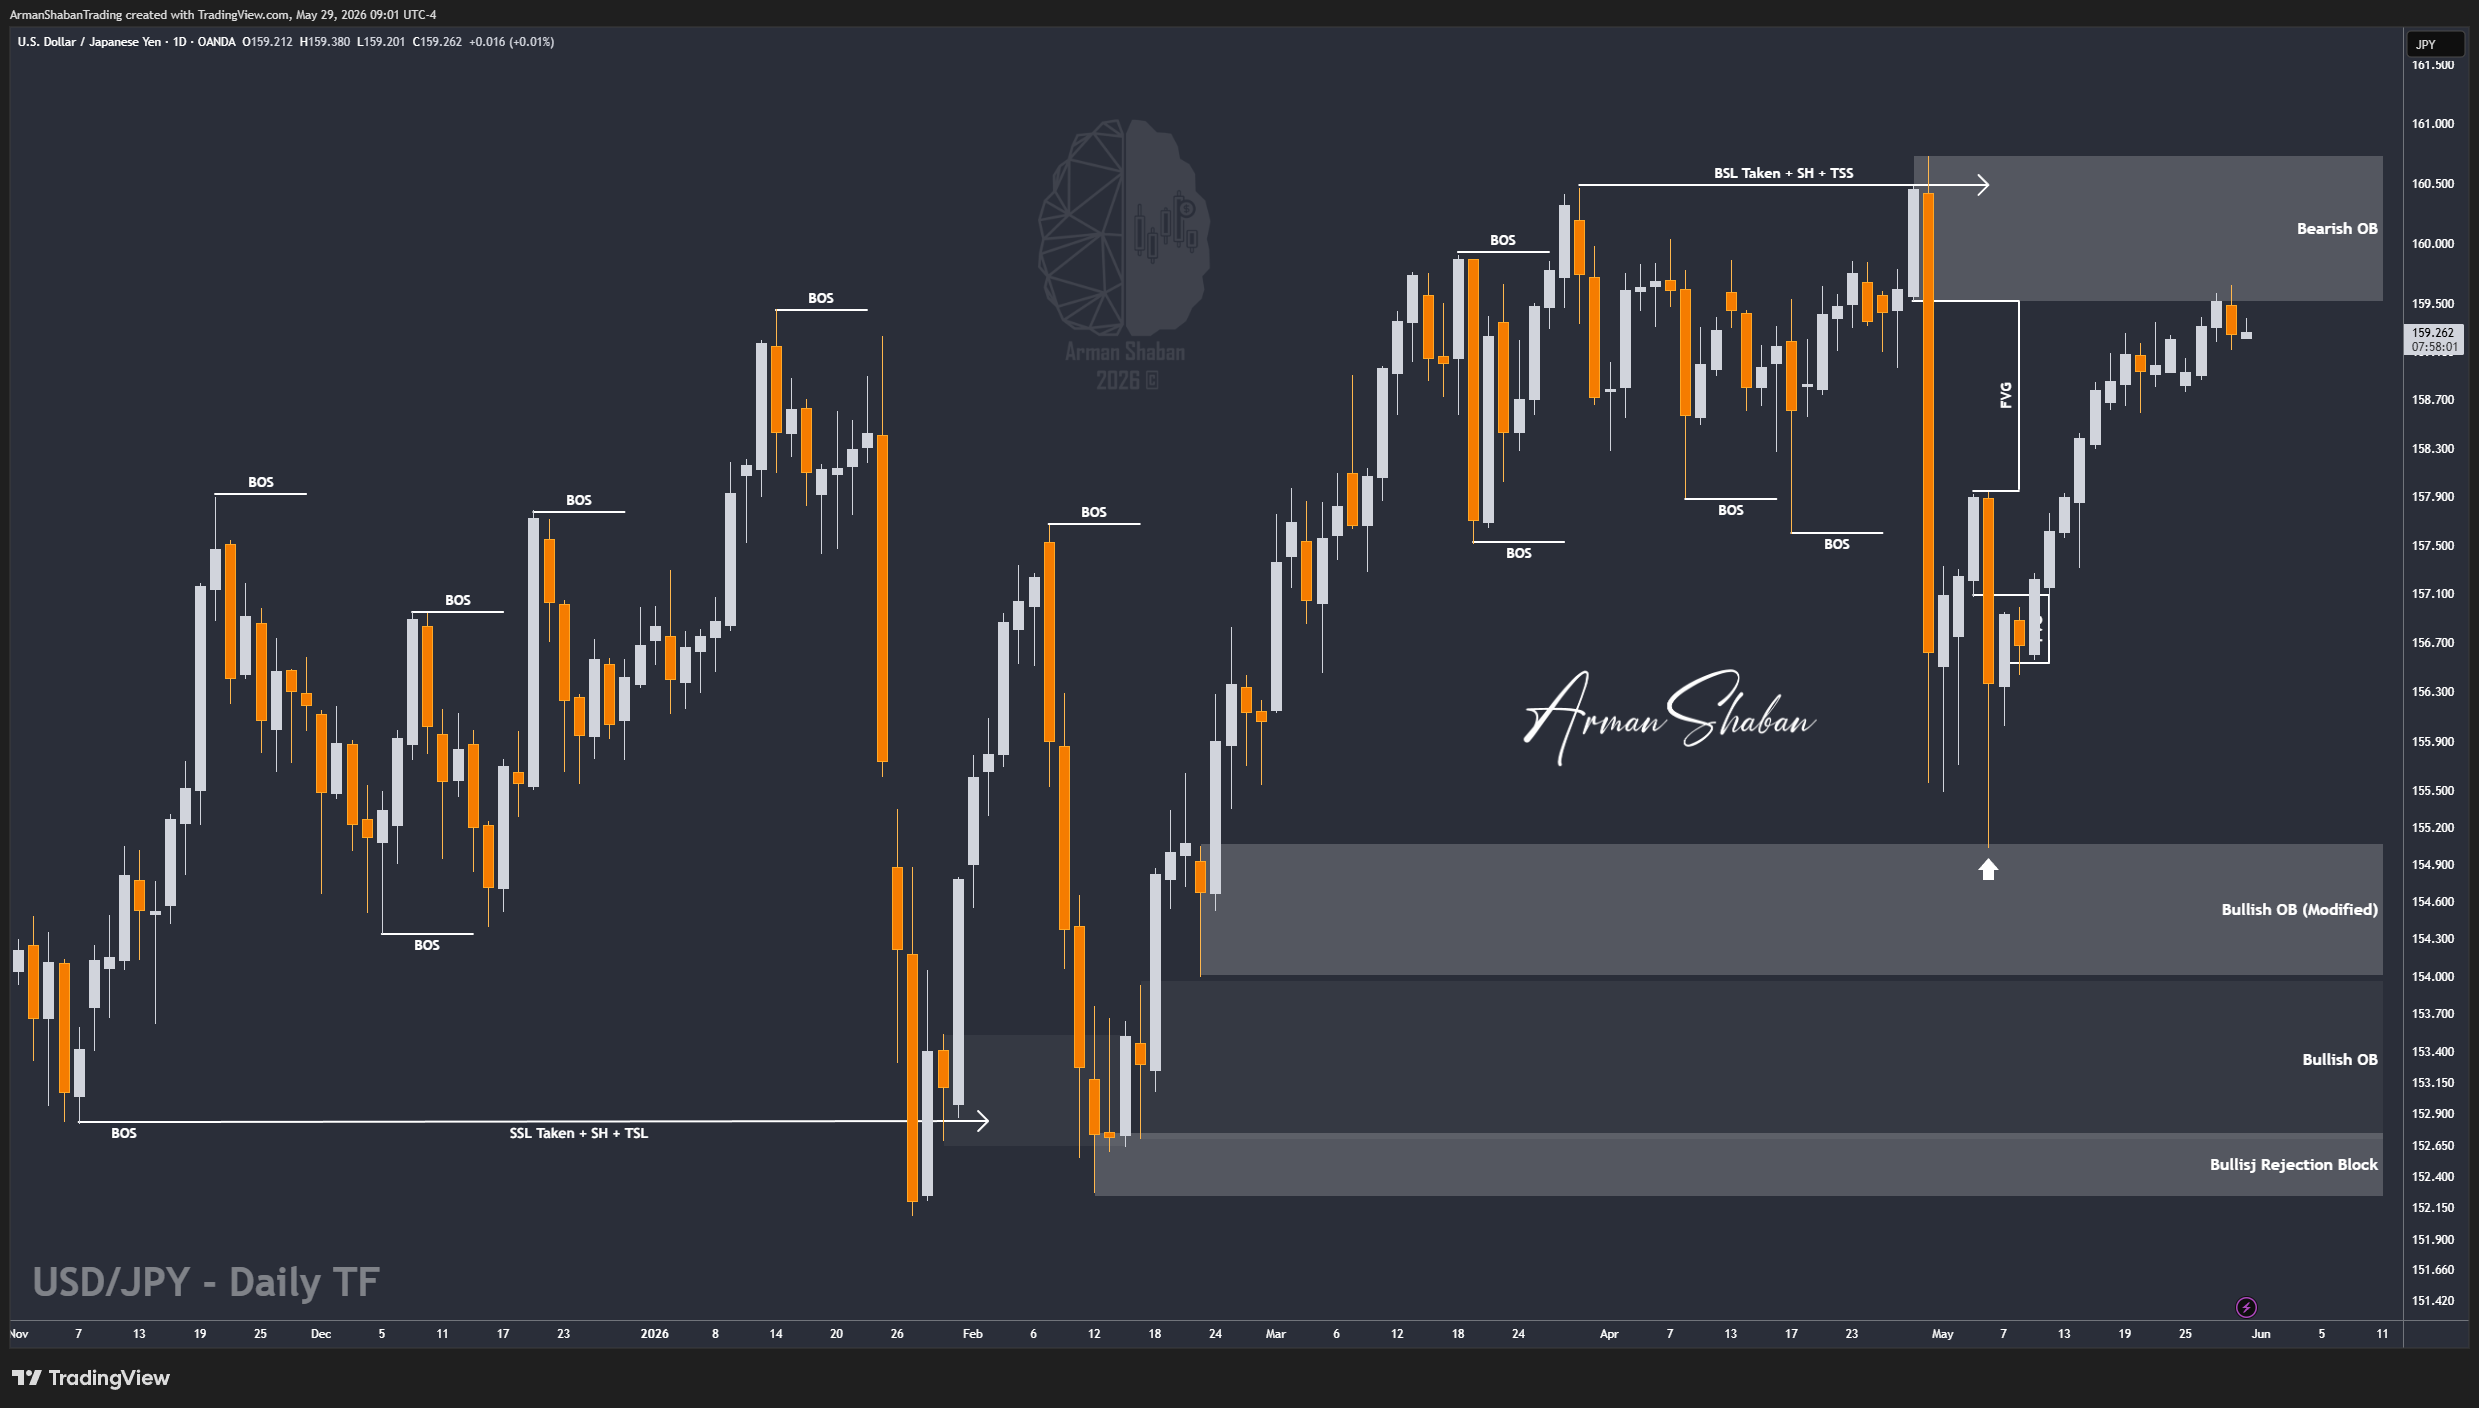
USD/JPY Analysis : By analyzing the #USDJPY chart on the Daily timeframe, we can see that after successfully filling the large FVG around the 159.50 region, price has entered a consolidation phase and has not yet managed to break above the key resistance area.
Yesterday’s candle closed around 159.246 and price is still trading around the same region, which means the primary bearish scenario remains fully valid. So far, sellers are successfully defending the upper supply zone and no bullish breakout has been confirmed.
From a structural perspective, the nearest supply zones remain around 159.20 – 160.00, followed by the stronger resistance cluster between 160.50 – 161.20. On the downside, the closest demand zones are located around 157.00 – 157.50, with deeper structural support sitting between 155.00 – 155.50.
As long as price remains below the higher supply zones, I continue to favor the bearish continuation scenario. The next downside targets remain 158.00, followed by 157.00, then 155.50, and potentially 154.00 if bearish momentum accelerates.
For now, the overall outlook remains unchanged. Price is simply consolidating beneath a major resistance zone while the market decides whether the next bearish leg is ready to begin.
(This Post on TradingView)
Author : Arman Shaban
To see more analyzes of Gold , Forex Pairs , Cryptocurrencies , Indices and Stocks , be sure to Follow and Join us on other Platforms :
– Public Telegram Channel
– YouTube Channel
– TradingView
– X (Twitter)
– How to join our FOREX VIP Channel ?
– How to join our Crypto VIP Channel ?
– CONTACT ME directly on Telegram

