Bitcoin Analysis – 28.May.2026
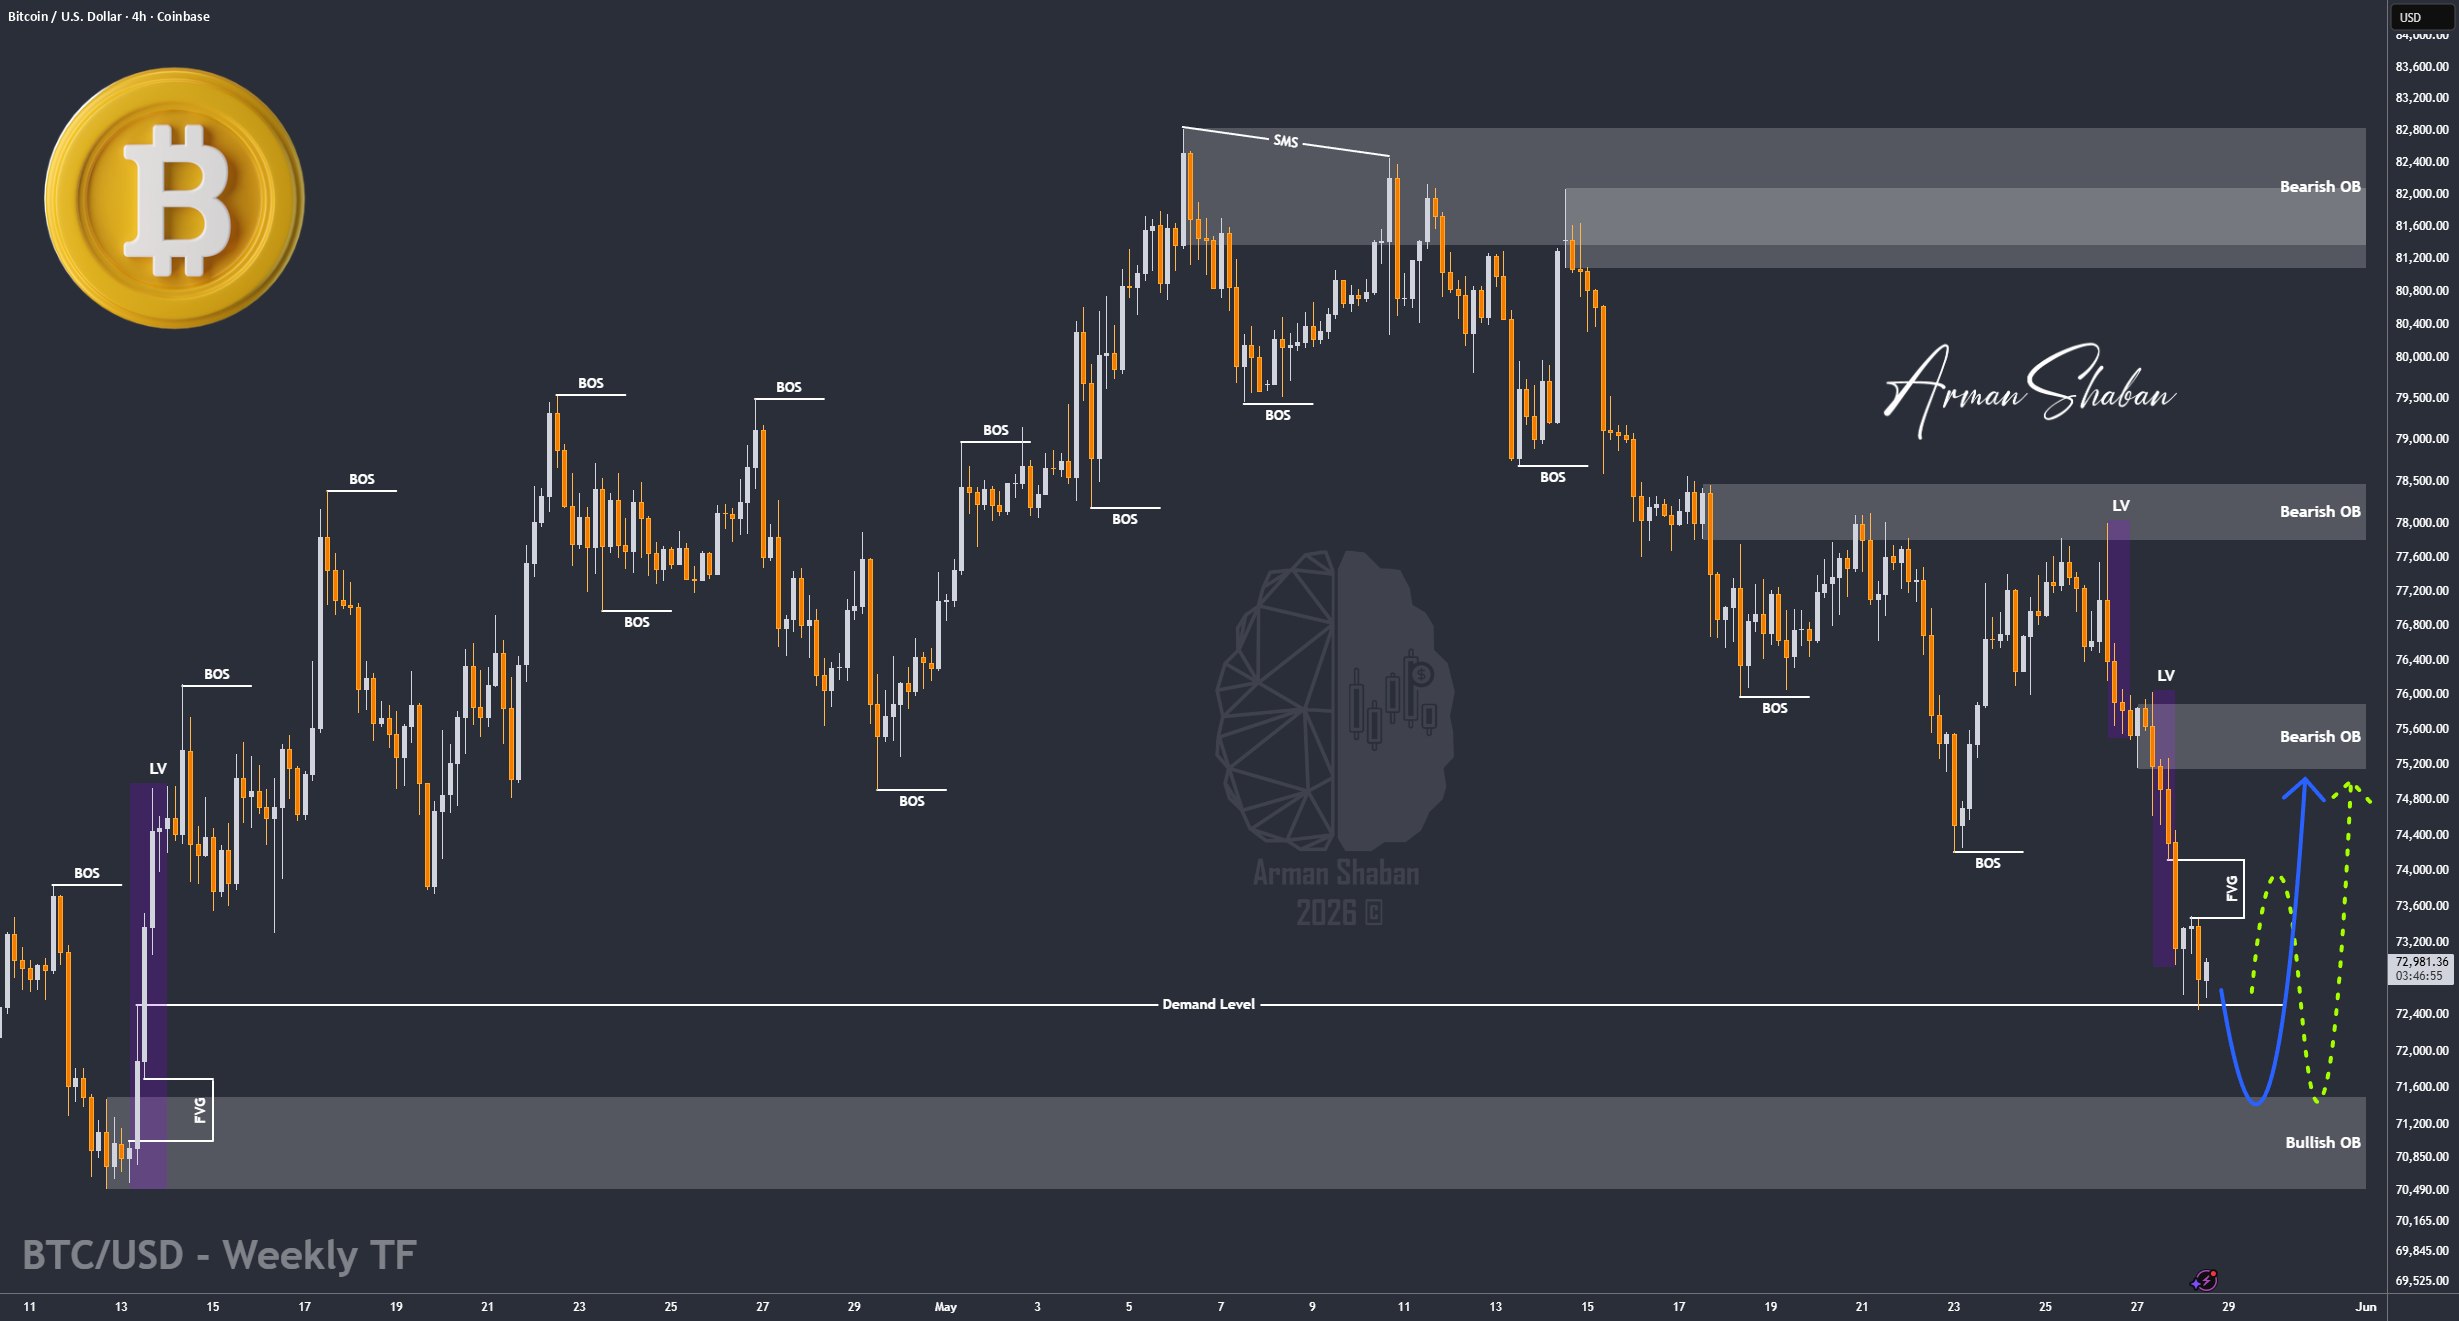
Bitcoin Analysis: By analyzing the #Bitcoin chart on the 4H timeframe, we can see that over the past few days BTC shifted into a bearish corrective phase. After reaching the $78K region, strong selling pressure entered the market and pushed price all the way down toward $72,400.
Currently, Bitcoin is trading around the $72,700 region and at this stage we are mainly watching two possible scenarios for the next move.
The first scenario is another bearish leg toward the key $70,500 – $71,500 demand zone in order to collect deeper liquidity before buyers step in again. In that case, the first bullish recovery target would be the $75K region.
The second scenario is a direct bullish recovery from the current levels without another deeper sweep, where BTC could push back toward $75K immediately if buyers regain momentum quickly.
From a structural perspective, the nearest demand zones are located around $70,500 – $71,500, with deeper support sitting near $68K – $69K. On the upside, the closest supply zones are forming around $74,500 – $75,500, followed by the stronger resistance cluster between $77K – $78K.
For now, the market is sitting inside a very sensitive area and the next reaction around these demand zones could determine the next major move for Bitcoin.
(This Post on TradingView)
Author : Arman Shaban
To see more analyzes of Gold , Forex Pairs , Cryptocurrencies , Indices and Stocks , be sure to Follow and Join us on other Platforms :
– Public Telegram Channel
– YouTube Channel
– TradingView
– X (Twitter)
– How to join our FOREX VIP Channel ?
– How to join our Crypto VIP Channel ?
– CONTACT ME directly on Telegram

