Gold Analysis – 24.Apr.2026
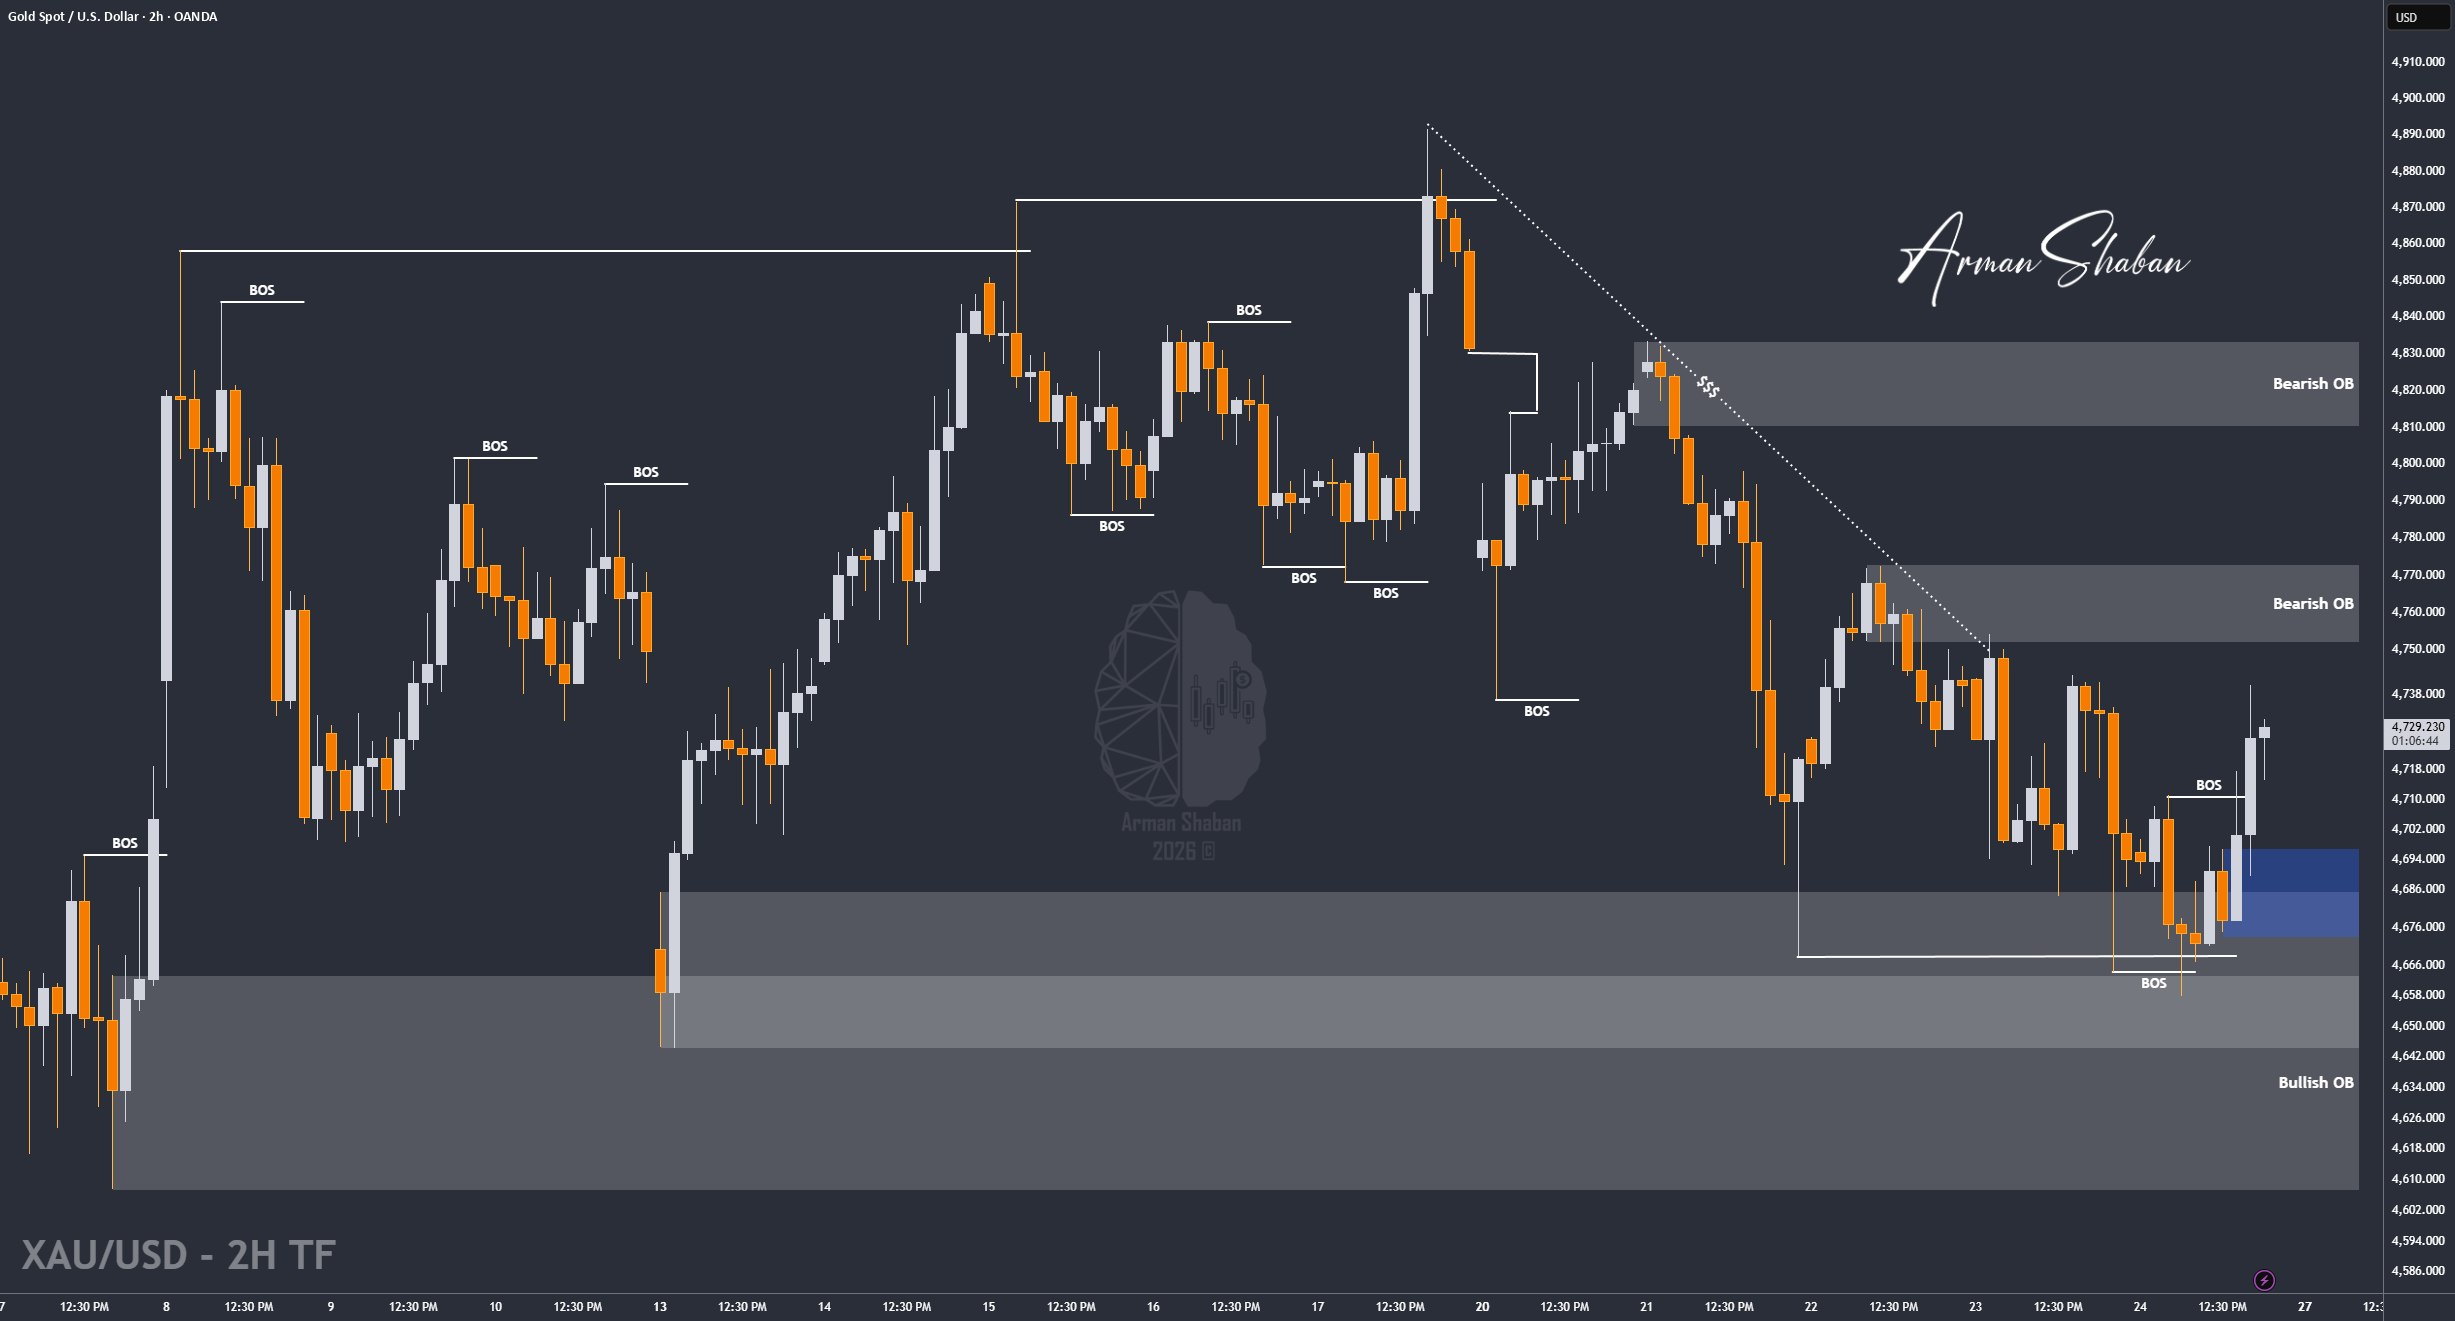
Gold Analysis: By analyzing the #Gold chart on the 4H timeframe, we can see that price first swept liquidity below $4664 with a move down to $4658, then strong demand stepped in and pushed Gold sharply higher toward $4740. After this expansion, price entered a minor correction and is now trading around the $4720 – $4730 region.
With today being the last trading day of the week, the market is shifting into a more headline-driven phase. Expectations around potential Iran–US negotiations could support short-term bullish momentum, at least into the early next week open.
From a structural perspective, the nearest demand zones are $4690 – $4710, with deeper support around $4650 – $4670. On the upside, the closest supply zones are $4740 – $4760, followed by a stronger resistance area between $4780 – $4810.
If buyers continue to build momentum, the next short-term upside targets are $4755, followed by $4780, then $4800, and potentially $4825.
In my view, these negotiations are unlikely to lead to a real outcome. There’s a high probability that tensions could rise again next week, and we might even see a renewed escalation or conflict scenario.
(This Post on TradingView)
Author : Arman Shaban
To see more analyzes of Gold , Forex Pairs , Cryptocurrencies , Indices and Stocks , be sure to Follow and Join us on other Platforms :
– Public Telegram Channel
– YouTube Channel
– TradingView
– X (Twitter)
– How to join our FOREX VIP Channel ?
– How to join our Crypto VIP Channel ?
– CONTACT ME directly on Telegram