Bitcoin Analysis – 17.Feb.2026
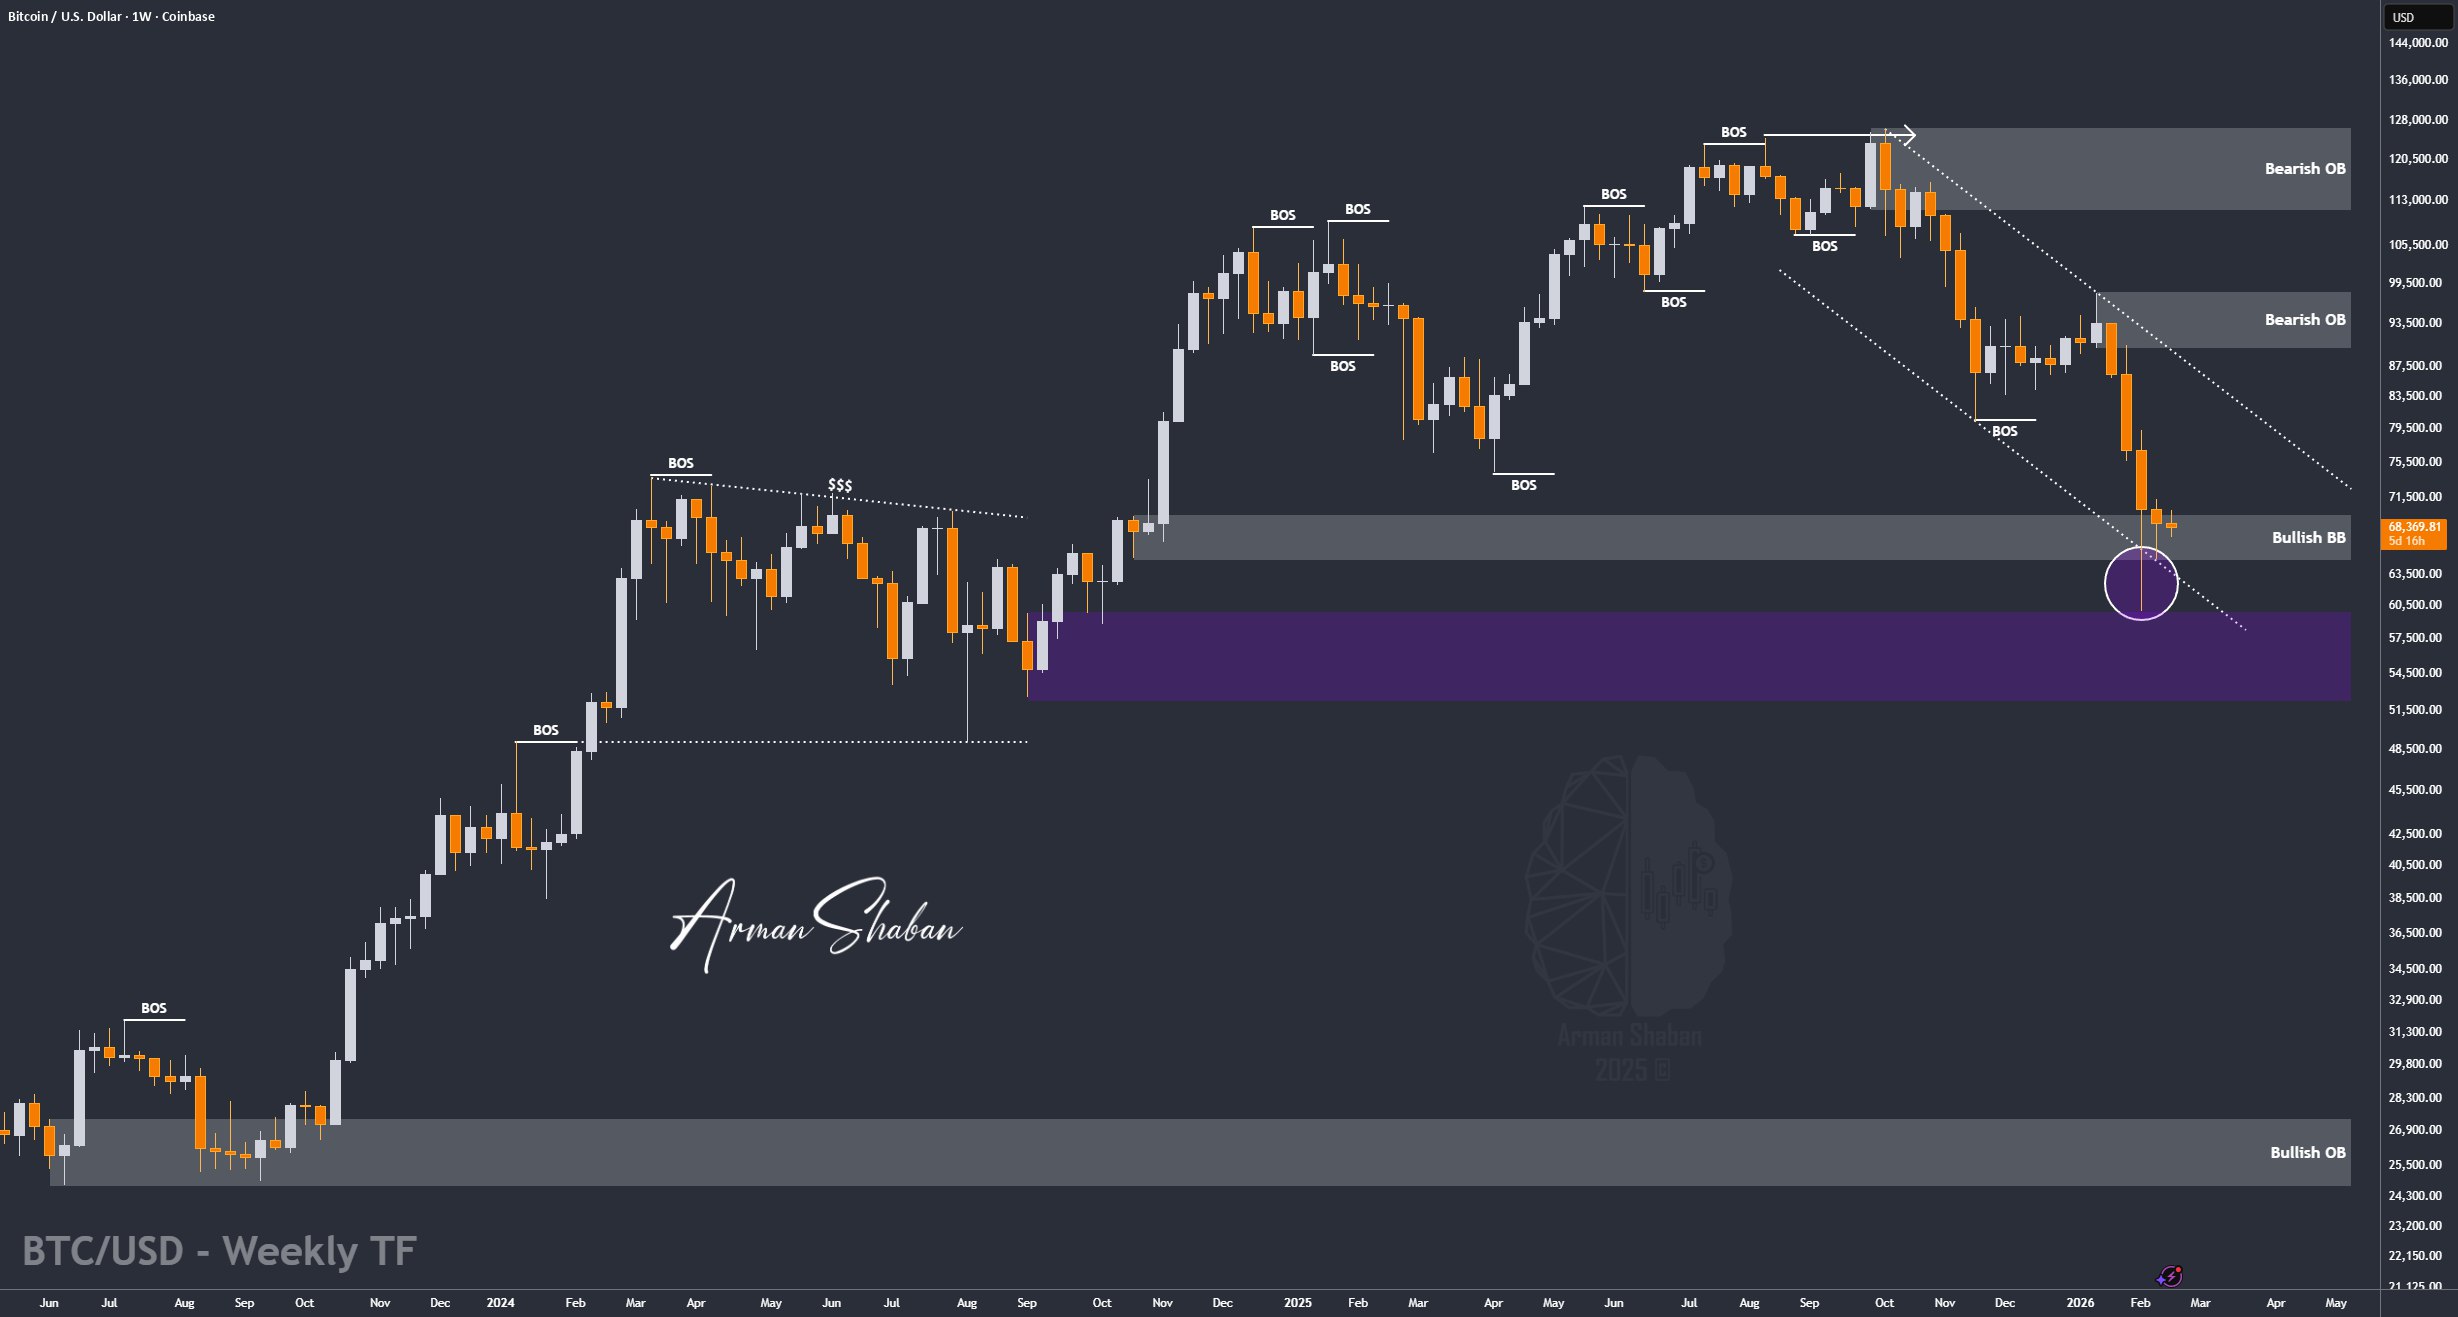
Bitcoin Analysis: By analyzing the #Bitcoin chart on the weekly timeframe, we can see that price is currently trading around the $68,400 level. Although buyers are still defending the broader $66,000 demand zone, we have not yet seen any clear confirmation of a strong bullish expansion.
All primary assumptions of the main analysis remain structurally valid, but confirmation is now essential. In order to validate the beginning of a new powerful bullish wave, we need to see a weekly candle close above the $71,500 level. Without this confirmation, upside momentum remains limited and the structure stays in a neutral-to-cautious phase.
If price fails to secure a strong weekly close above $71,500, the risk of further downside pressure increases and we may see a deeper corrective move in Bitcoin before any sustainable bullish continuation.
(This Post on TradingView)
Author : Arman Shaban
To see more analyzes of Gold , Forex Pairs , Cryptocurrencies , Indices and Stocks , be sure to Follow and Join us on other Platforms :
– Public Telegram Channel
– YouTube Channel
– TradingView
– X (Twitter)
– How to join our FOREX VIP Channel ?
– How to join our Crypto VIP Channel ?
– CONTACT ME directly on Telegram