Bitcoin Analysis – 13.Feb.2026
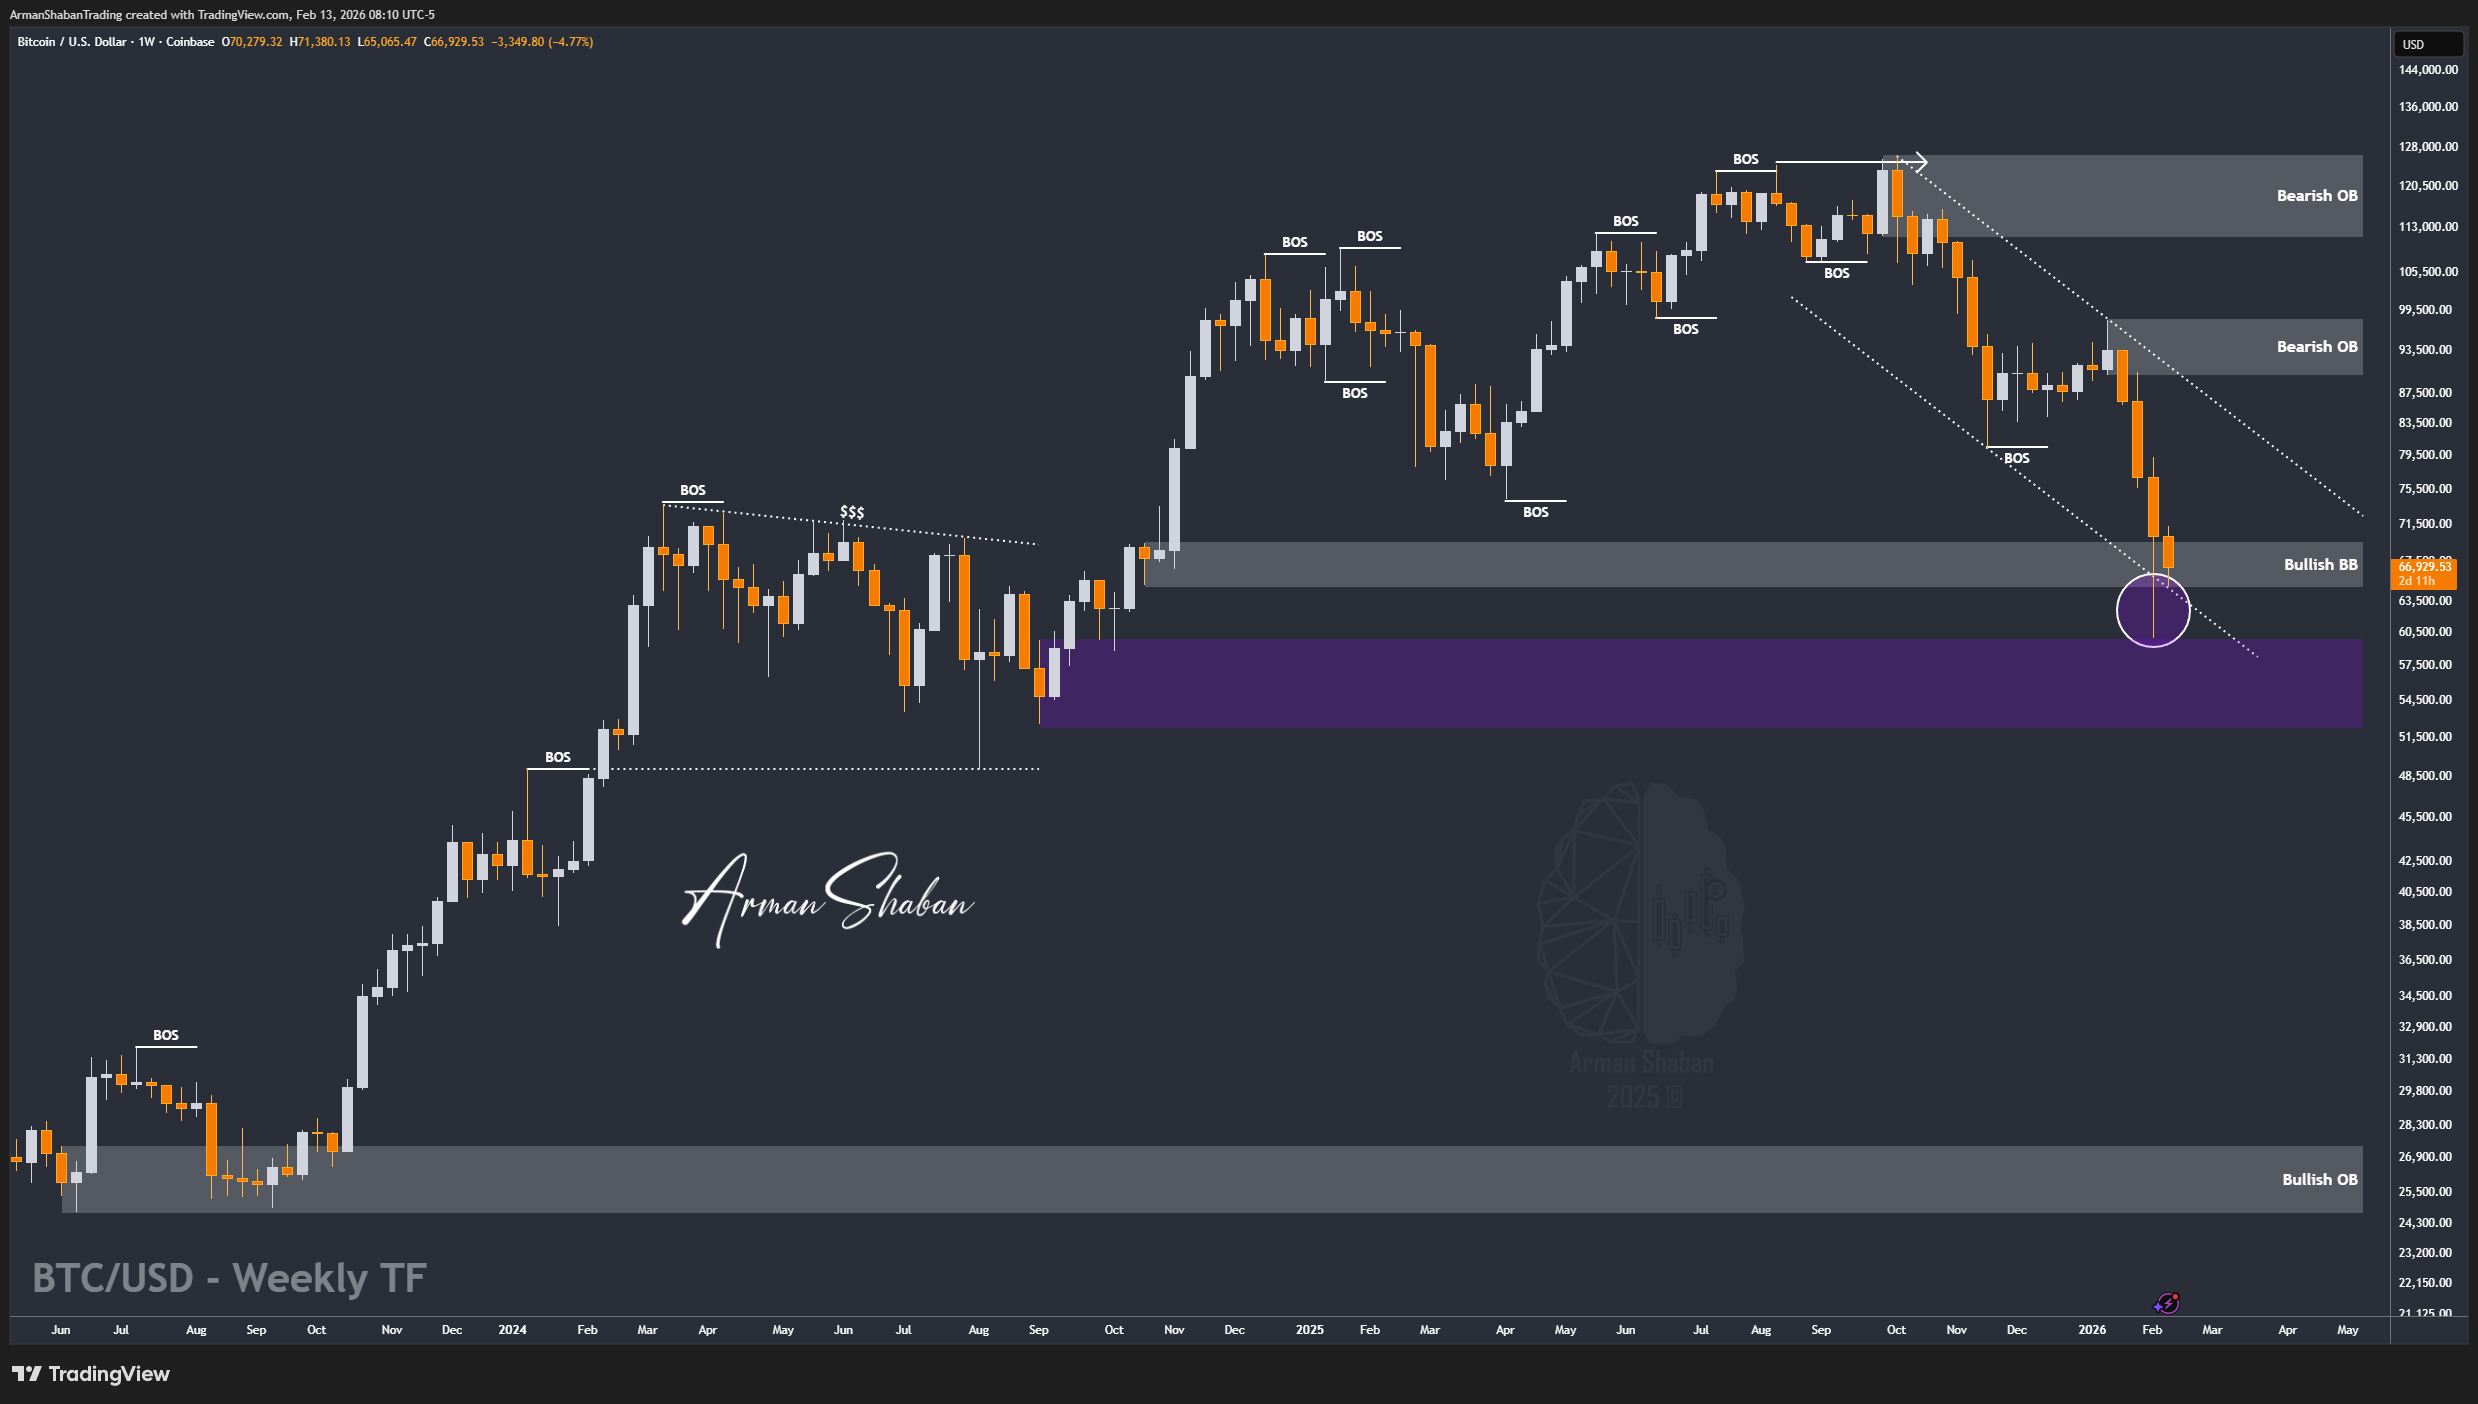
Bitcoin Analysis: By analyzing the #Bitcoin chart on the weekly timeframe, we can see that after the previous update, price dropped toward the $65,000 level, but the move did not sustain. Bitcoin quickly reclaimed the $66,000 zone and is now trading around the $67,000 area, showing that buyers are still defending this critical demand region.
All primary assumptions of the main analysis remain valid. As long as price stabilizes and holds above the $66,000 level, the broader bullish structure stays intact and we can expect the beginning of the next mid-term bullish wave. A confirmed consolidation above this zone would strengthen the probability of continuation toward higher levels.
If bullish momentum builds from here, the next upside targets to watch are $71,300, followed by $74,800, and potentially the $78,000 area in case of strong expansion.
This chart will continue to be updated step by step as price reacts to key levels.
(This Post on TradingView)
Author : Arman Shaban
To see more analyzes of Gold , Forex Pairs , Cryptocurrencies , Indices and Stocks , be sure to Follow and Join us on other Platforms :
– Public Telegram Channel
– YouTube Channel
– TradingView
– X (Twitter)
– How to join our FOREX VIP Channel ?
– How to join our Crypto VIP Channel ?
– CONTACT ME directly on Telegram