Gold Analysis – 02.Feb.2026
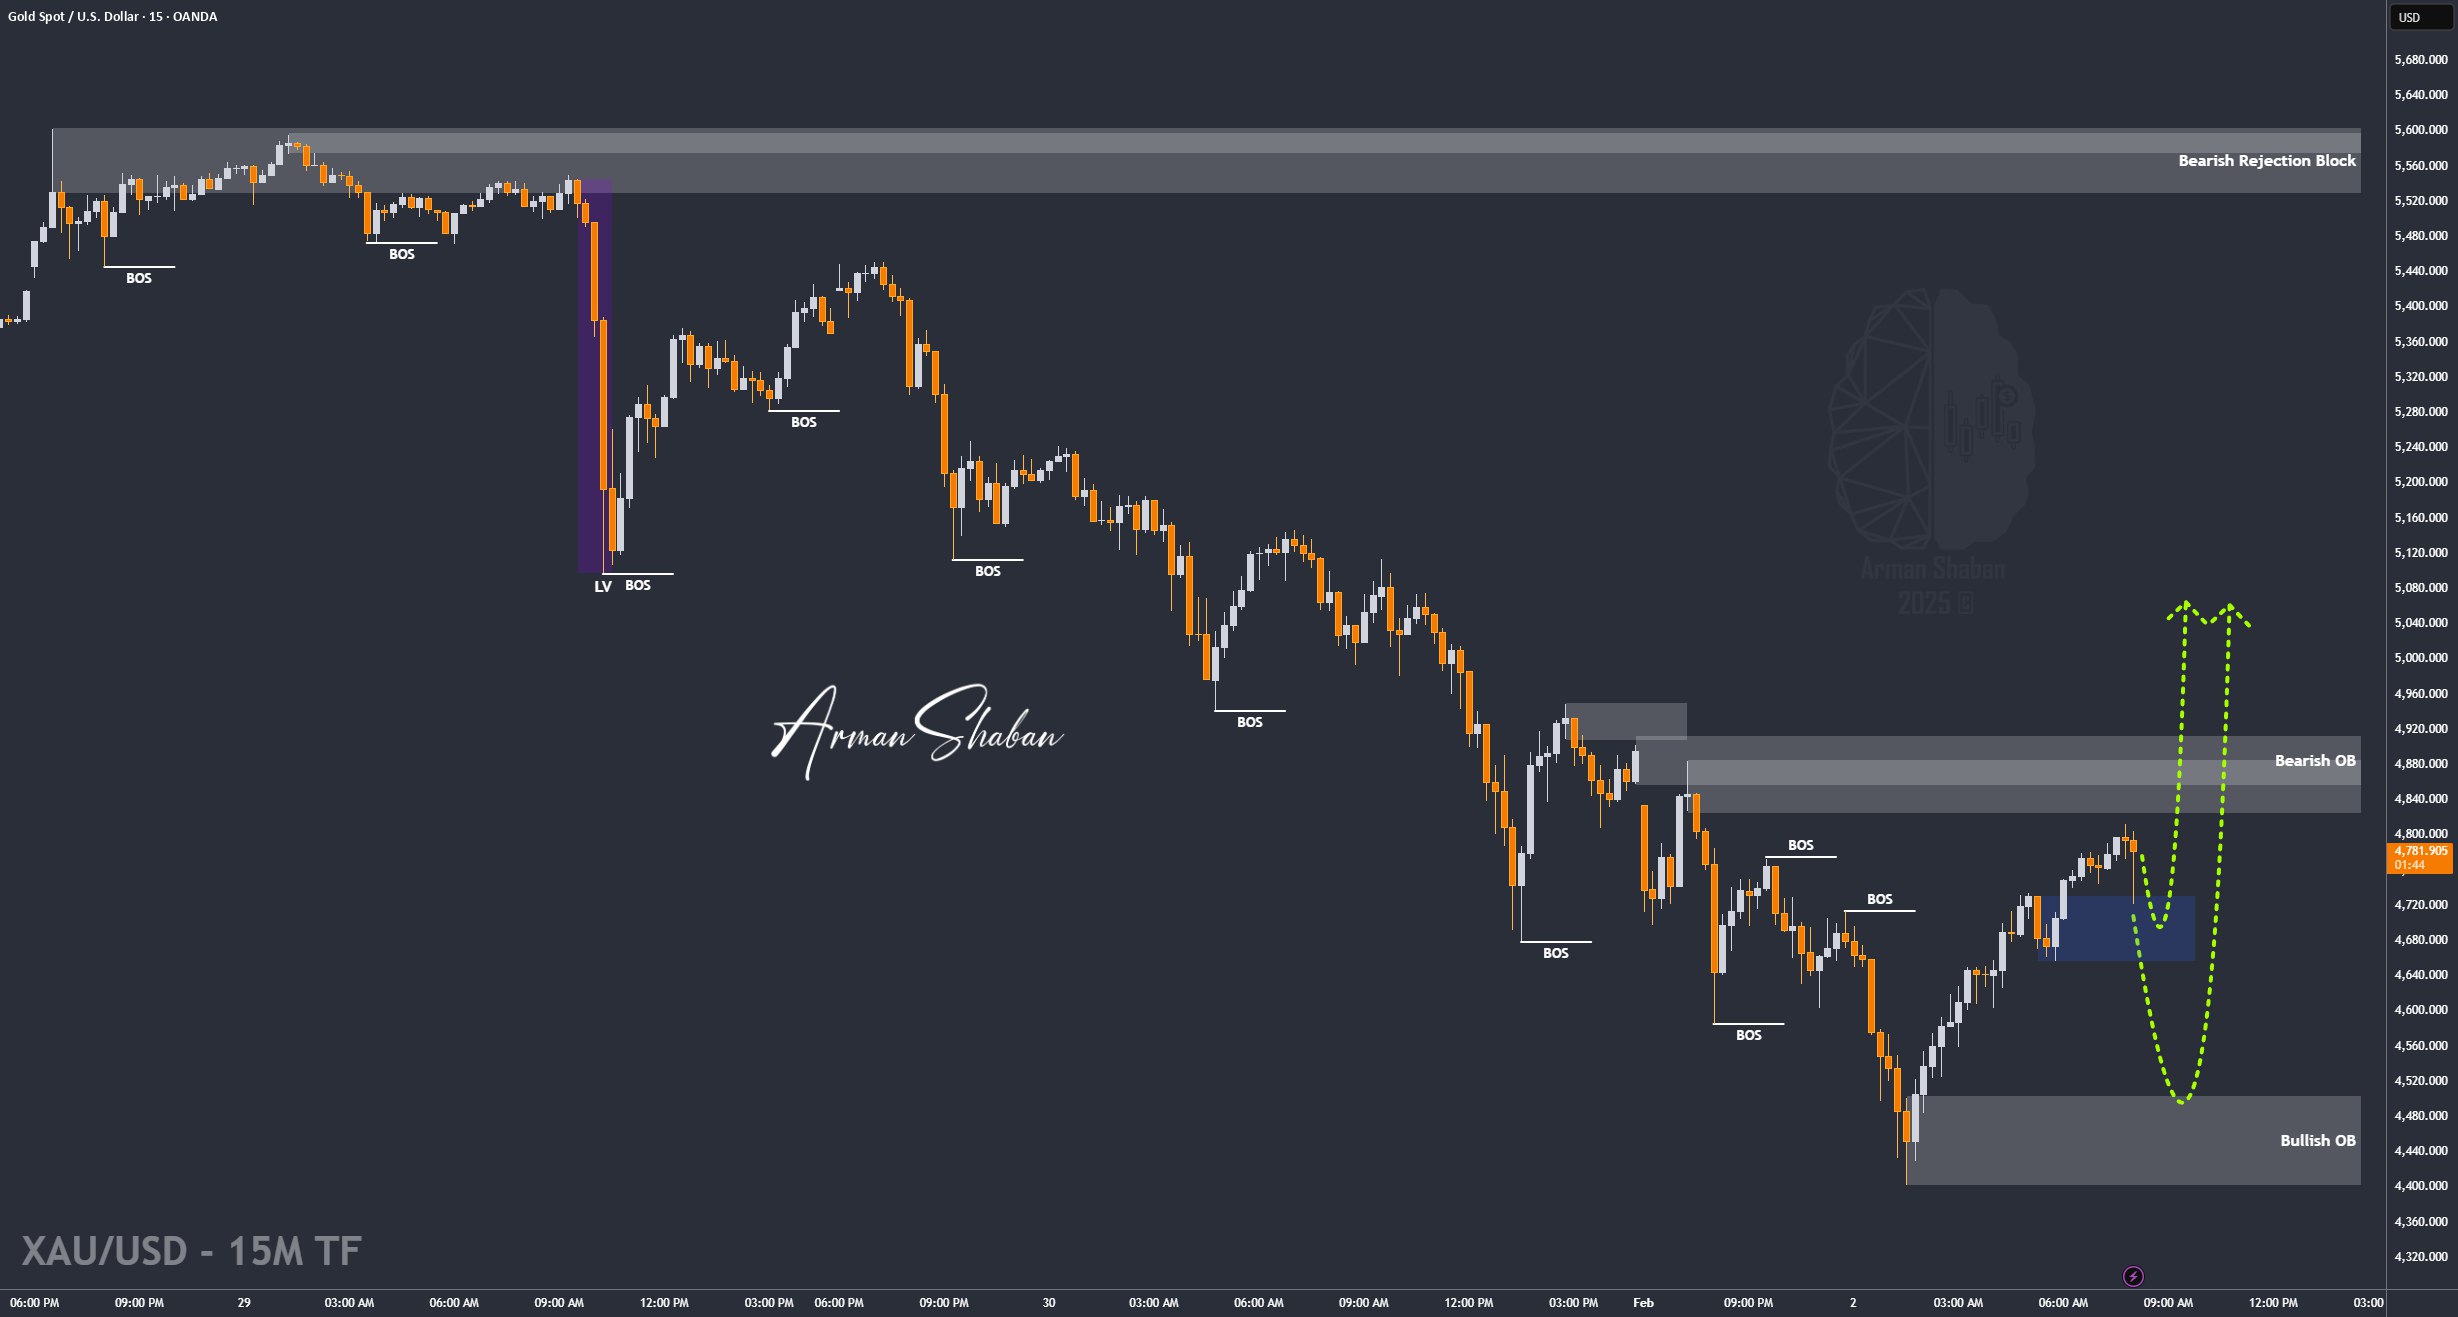
Gold Analysis: By analyzing the #Gold chart on the 4 hour timeframe, we can see that after a very strong rally, gold printed a historic high near $5600. Once price reached this level, it faced heavy selling pressure and experienced a massive historical drop of more than $1200, falling all the way to $4400, which equals roughly a 20% correction.
After hitting $4400, demand stepped in aggressively and pushed gold back up to $4800. These days, gold is showing extreme volatility, with average hourly moves of 1500 to 2000 pips, which has significantly increased risk for traders.
At the moment, gold is trading around $4775. If price can hold and stabilize above $4727, we can expect further upside toward levels above $5000. With strong support on this analysis, I will share much more detailed insights on gold’s moves and the key drivers behind this rally and correction very soon.
(This Post on TradingView)
Author : Arman Shaban
To see more analyzes of Gold , Forex Pairs , Cryptocurrencies , Indices and Stocks , be sure to Follow and Join us on other Platforms :
– Public Telegram Channel
– YouTube Channel
– TradingView
– X (Twitter)
– How to join our FOREX VIP Channel ?
– How to join our Crypto VIP Channel ?
– CONTACT ME directly on Telegram