Cardano Analysis – 24.Nov.2025
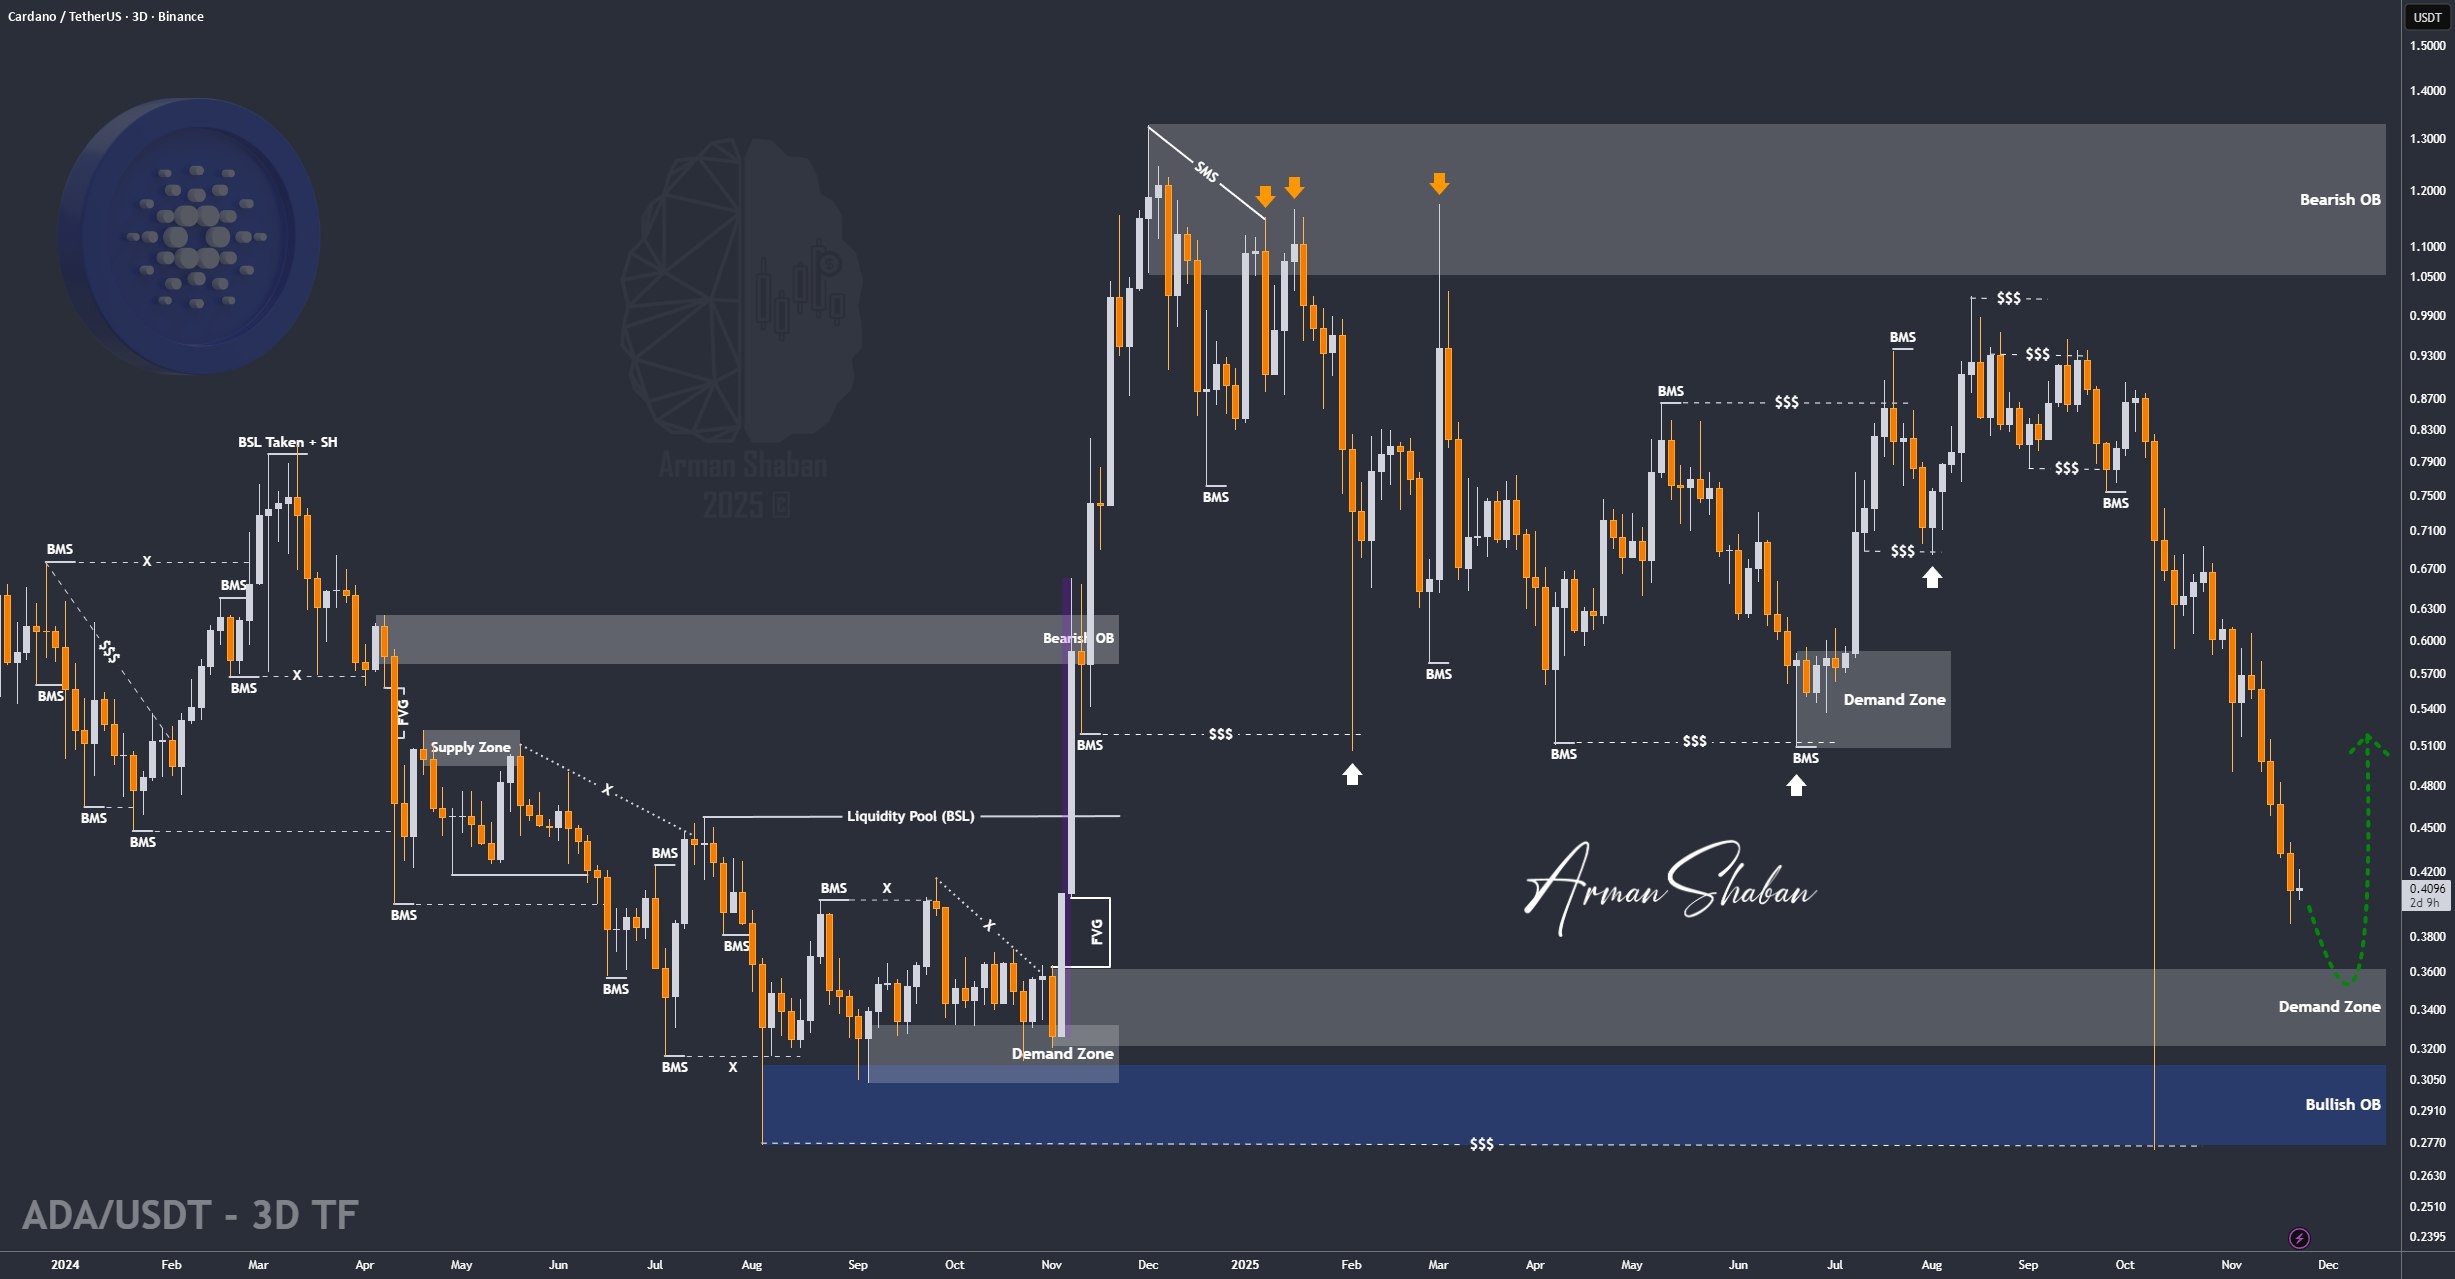
Cardano Analysis: By analyzing the $ADA chart on the 3 day timeframe, we can see that price finally dropped to 0.38, which confirms the bearish pressure we talked about earlier. ADA is now trading near 0.40 and the chart still looks weak. Buyers are not showing real strength and momentum is clearly on the sellers’ side.
If the drop continues, the next downside target I am watching is 0.36. Make sure you monitor price reaction at this level.
From my perspective, the 0.32 to 0.36 zone is a possible long term accumulation area for investors who use proper risk management and do their own research (DYOR). For now the bias stays bearish until ADA reclaims strong levels with real demand.
(This Post on TradingView)
Author : Arman Shaban
To see more analyzes of Gold , Forex Pairs , Cryptocurrencies , Indices and Stocks , be sure to Follow and Join us on other Platforms :
– Public Telegram Channel
– YouTube Channel
– TradingView
– X (Twitter)
– How to join our FOREX VIP Channel ?
– How to join our Crypto VIP Channel ?
– CONTACT ME directly on Telegram