Gold Analysis – 27.Jul.2026
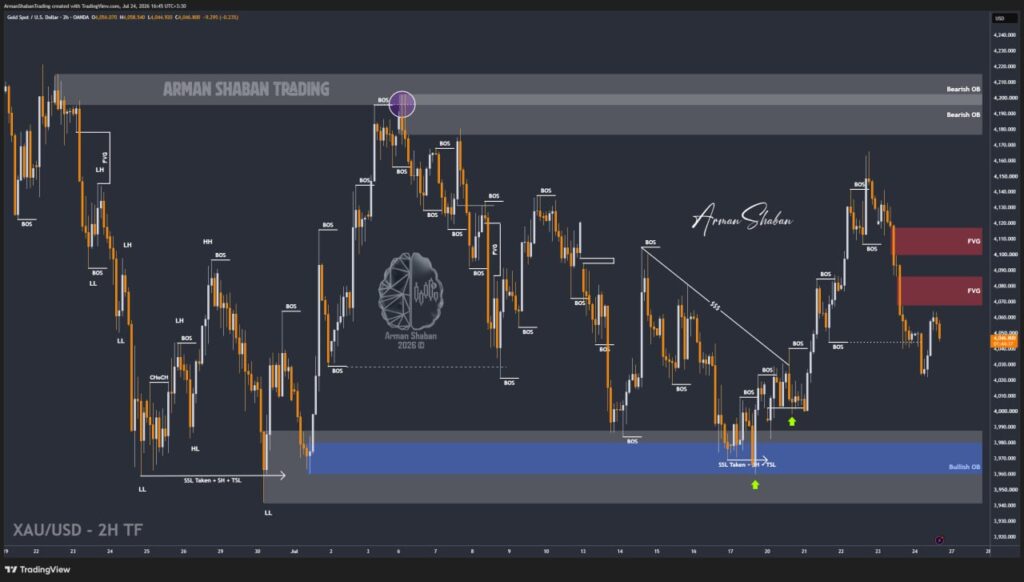
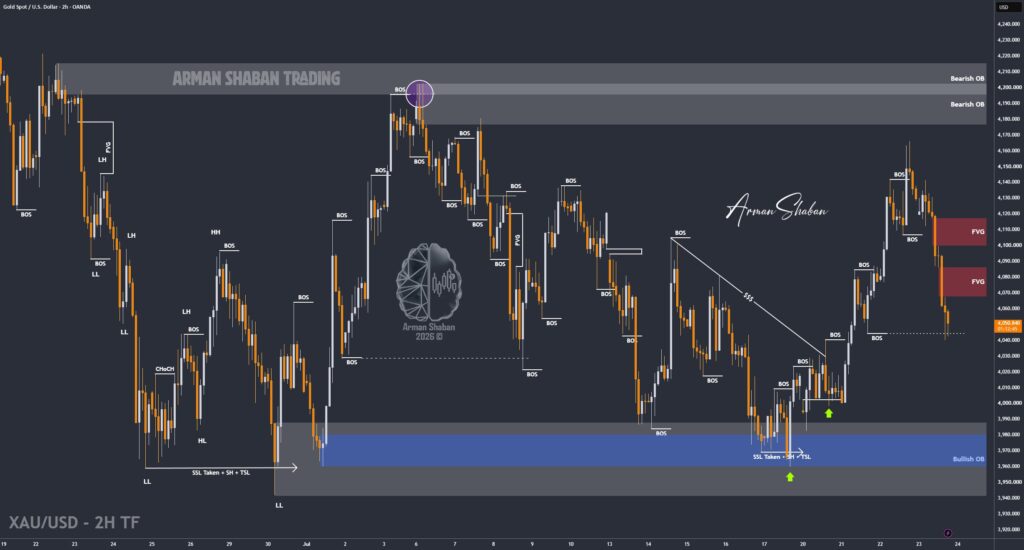
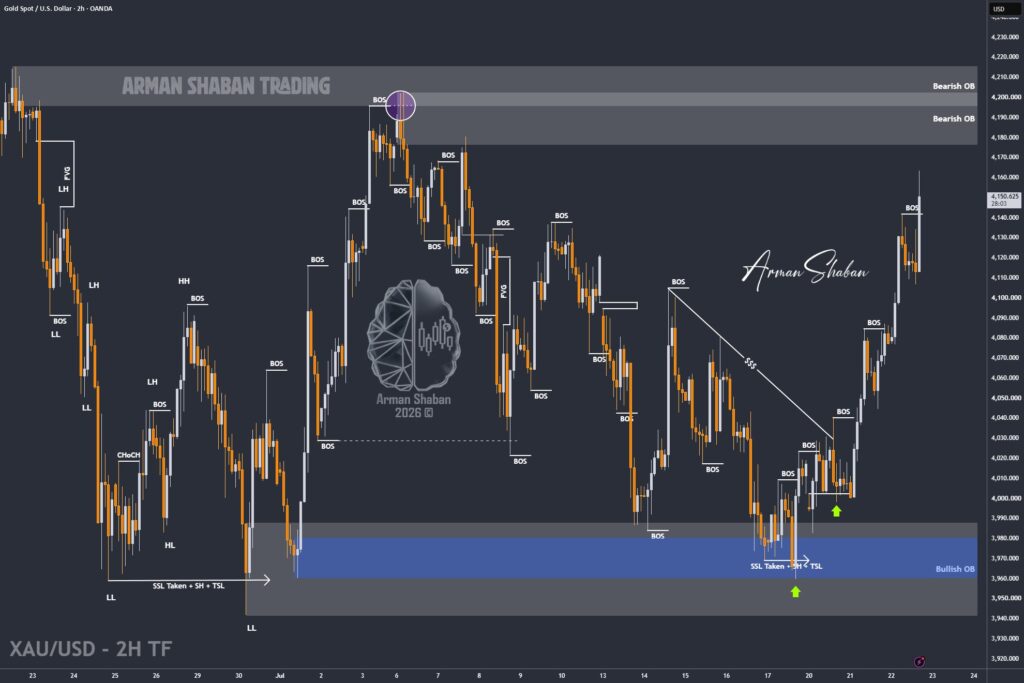
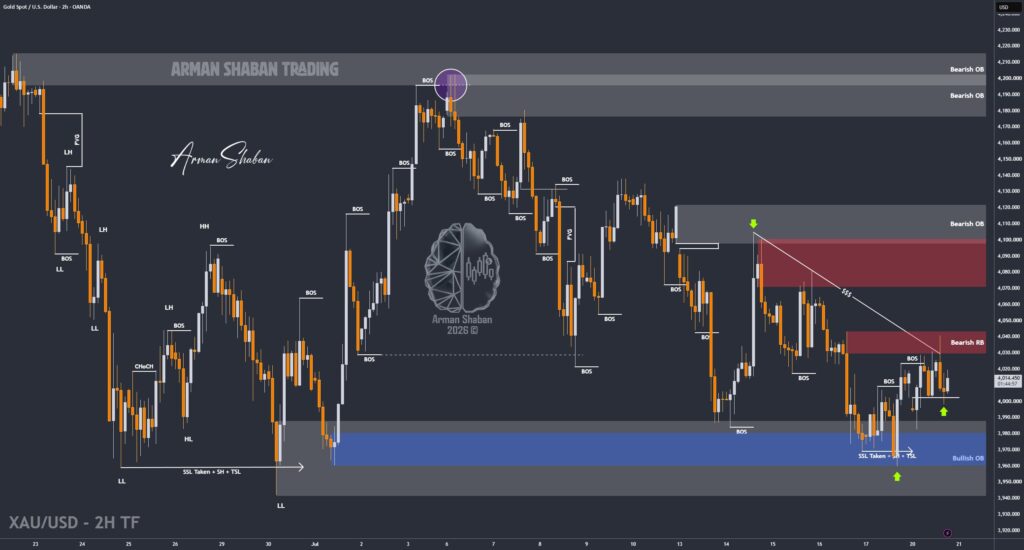
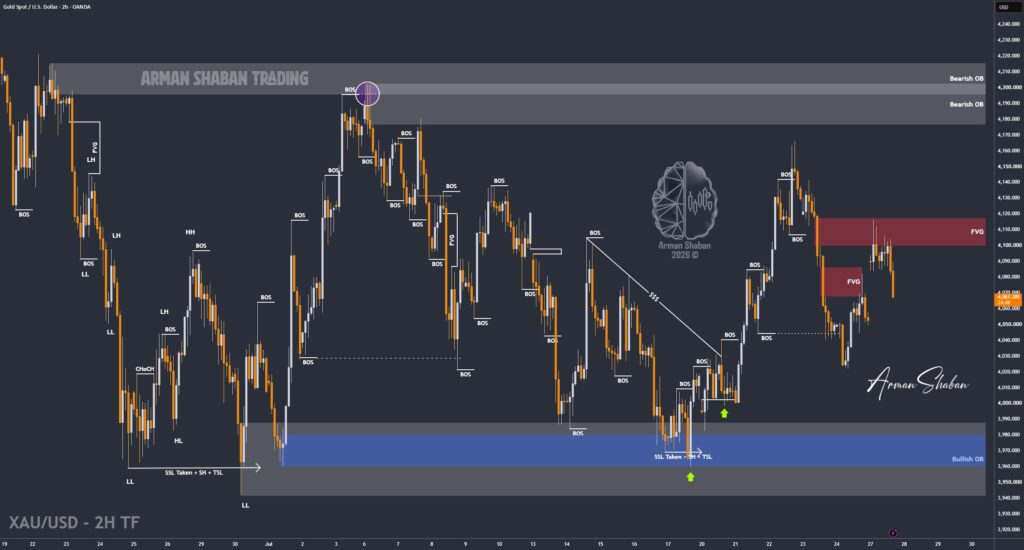
Gold Analysis: By analyzing the #Gold chart on the 2H timeframe, we can see that after the previous analysis, price first filled the initial FVG and then dropped toward $4049, eventually closing the week around $4052. At the beginning of the new week, Gold opened with a large bullish gap around $4090 and extended its rally…
Read more