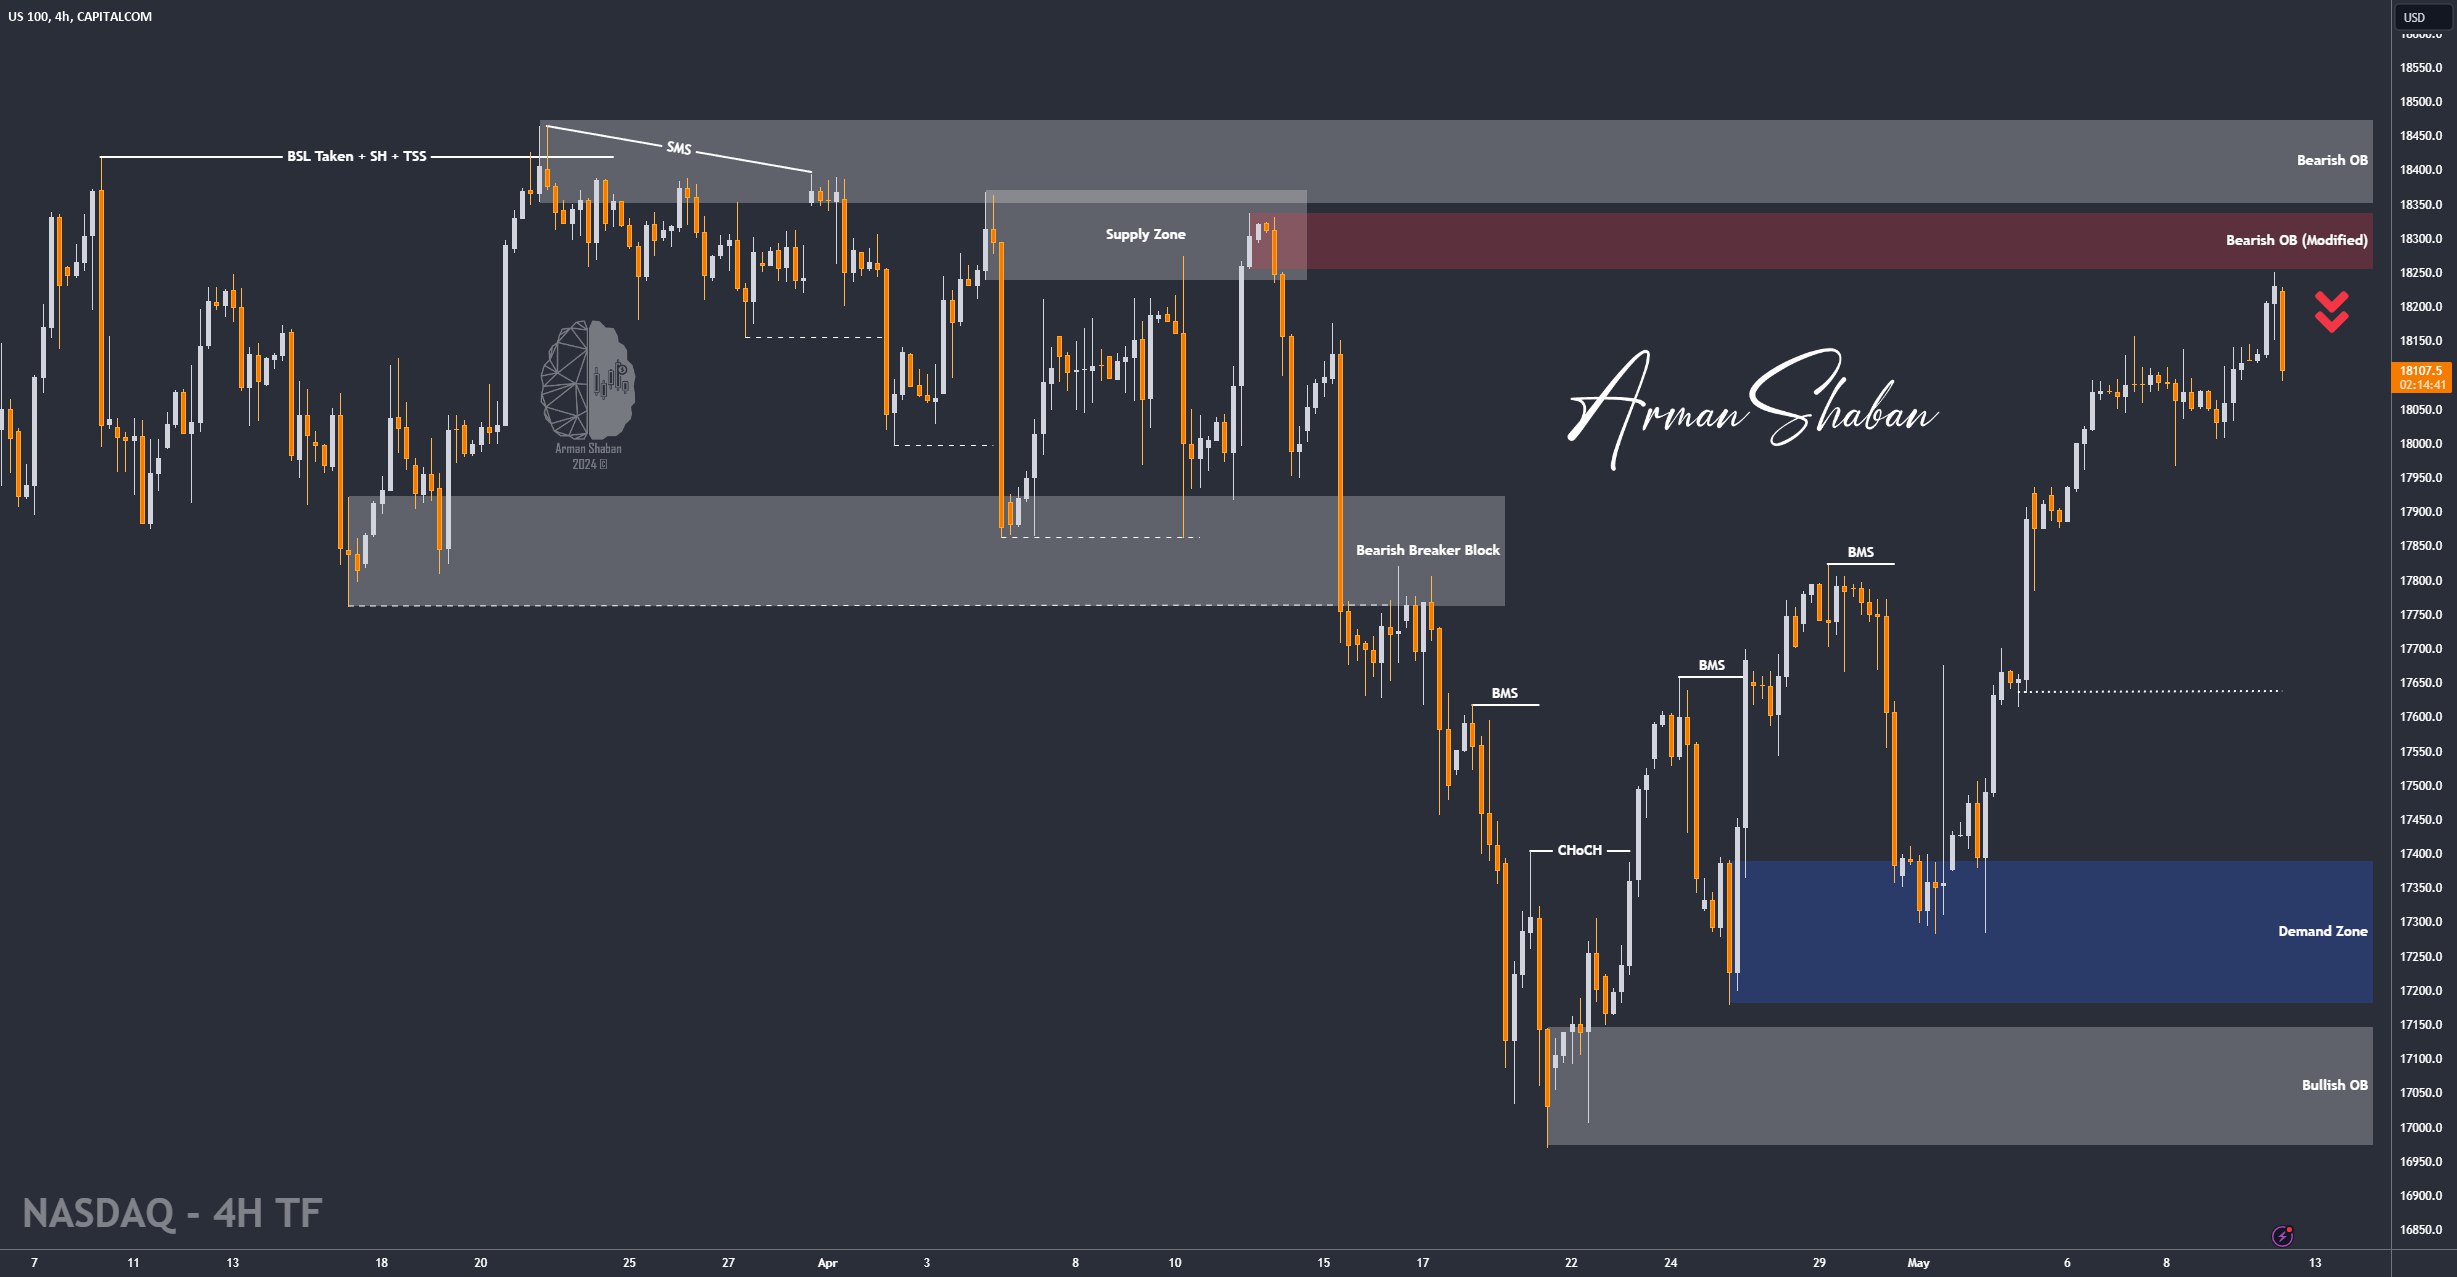
NASDAQ Analysis – 10.May.2024

NASDAQ Analysis: After examining the NASDAQ chart on a 4-hour timeframe, we noticed that the price, following our previous analysis, experienced a drop of 170 pips and managed to correct to 17,970. Subsequently, it regained demand and moved towards the second supply zone. Today, as the NASDAQ index reached 18,250, we witnessed a significant drop from this level, with a decline of 160 pips down to 18,090. It is likely that we will see further declines in the NASDAQ chart in next week. I hope you have made the most of this analysis this week!
(This Post on TradingView)
Author : Arman Shaban
To see more analyzes of Gold , Forex Pairs , Cryptocurrencies , Indices and Stocks , be sure to Follow and Join us on other Platforms :
– Public Telegram Channel
– YouTube Channel
– TradingView
– X (Twitter)
– How to join our FOREX VIP Channel ?
– How to join our Crypto VIP Channel ?
– CONTACT ME directly on Telegram